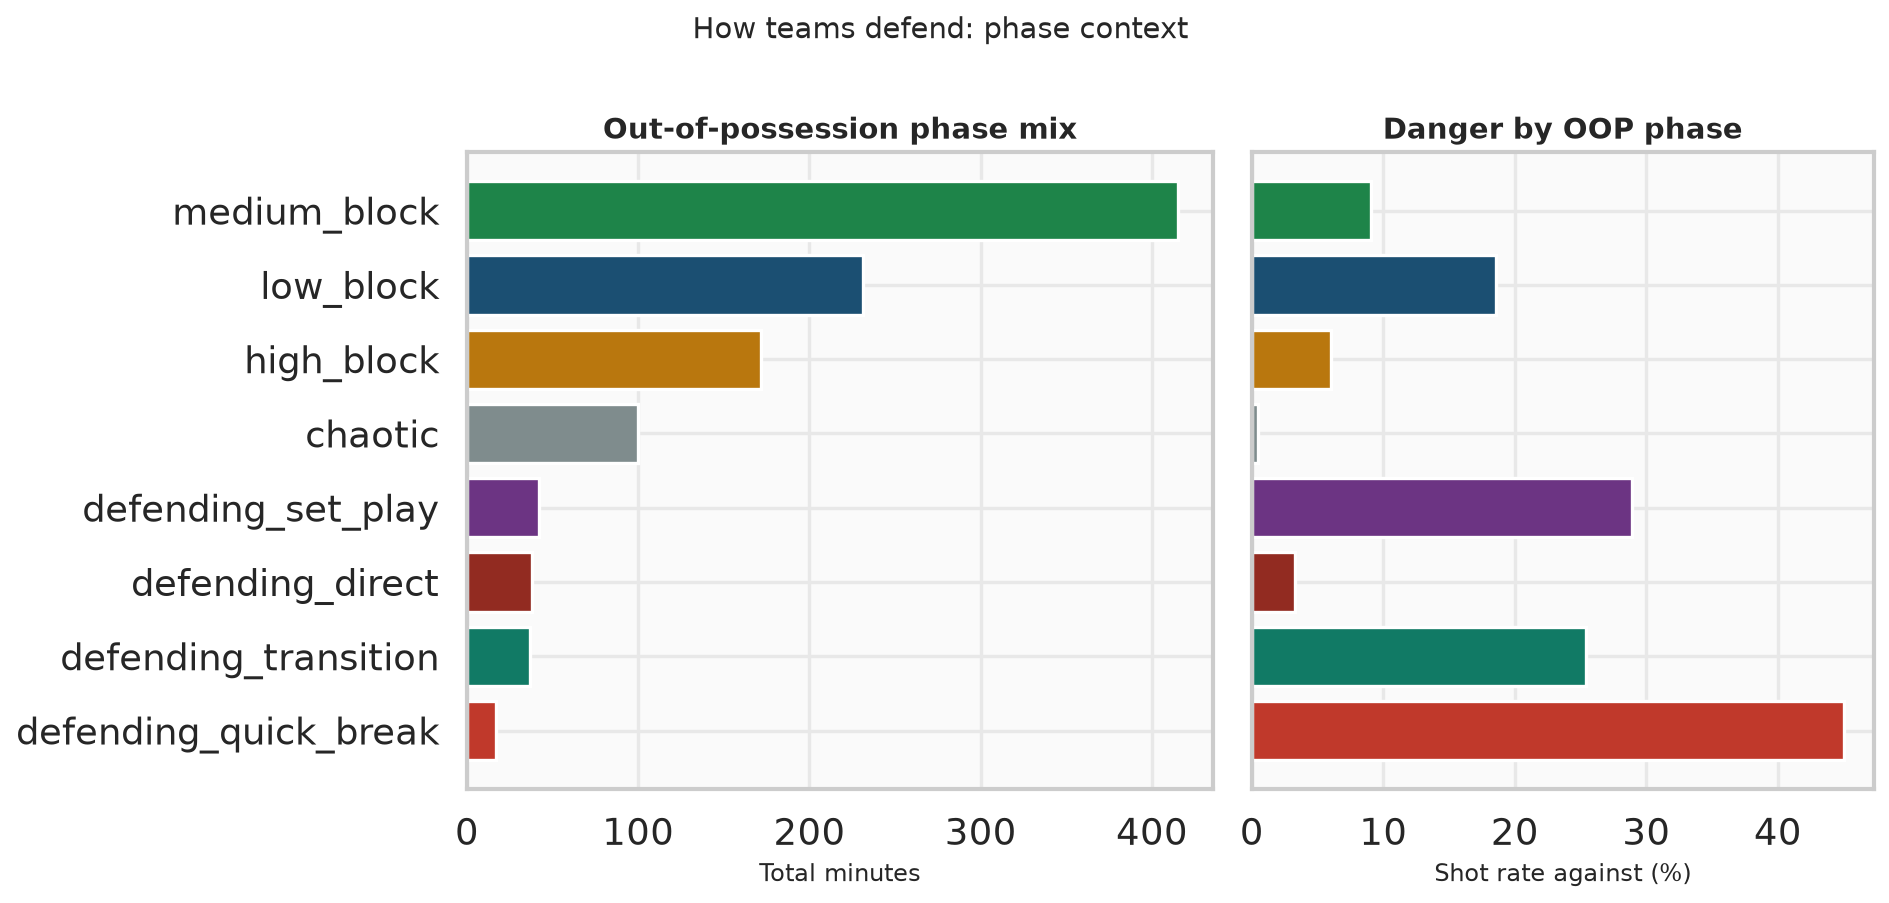
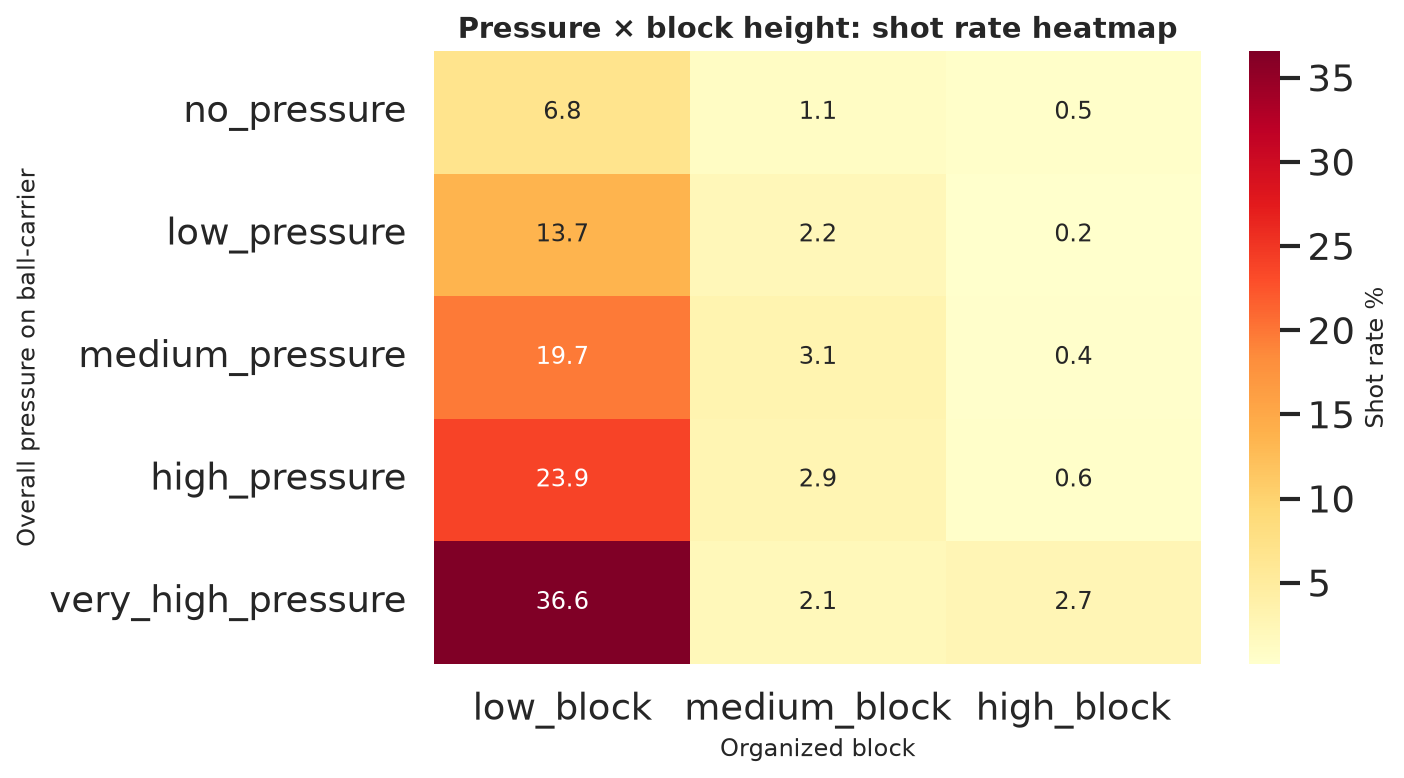
Shot rates are about 18.5–18.7% in a low block, 9.0–9.3% in a medium block, and 6.0% in a high block.
On-ball pressure
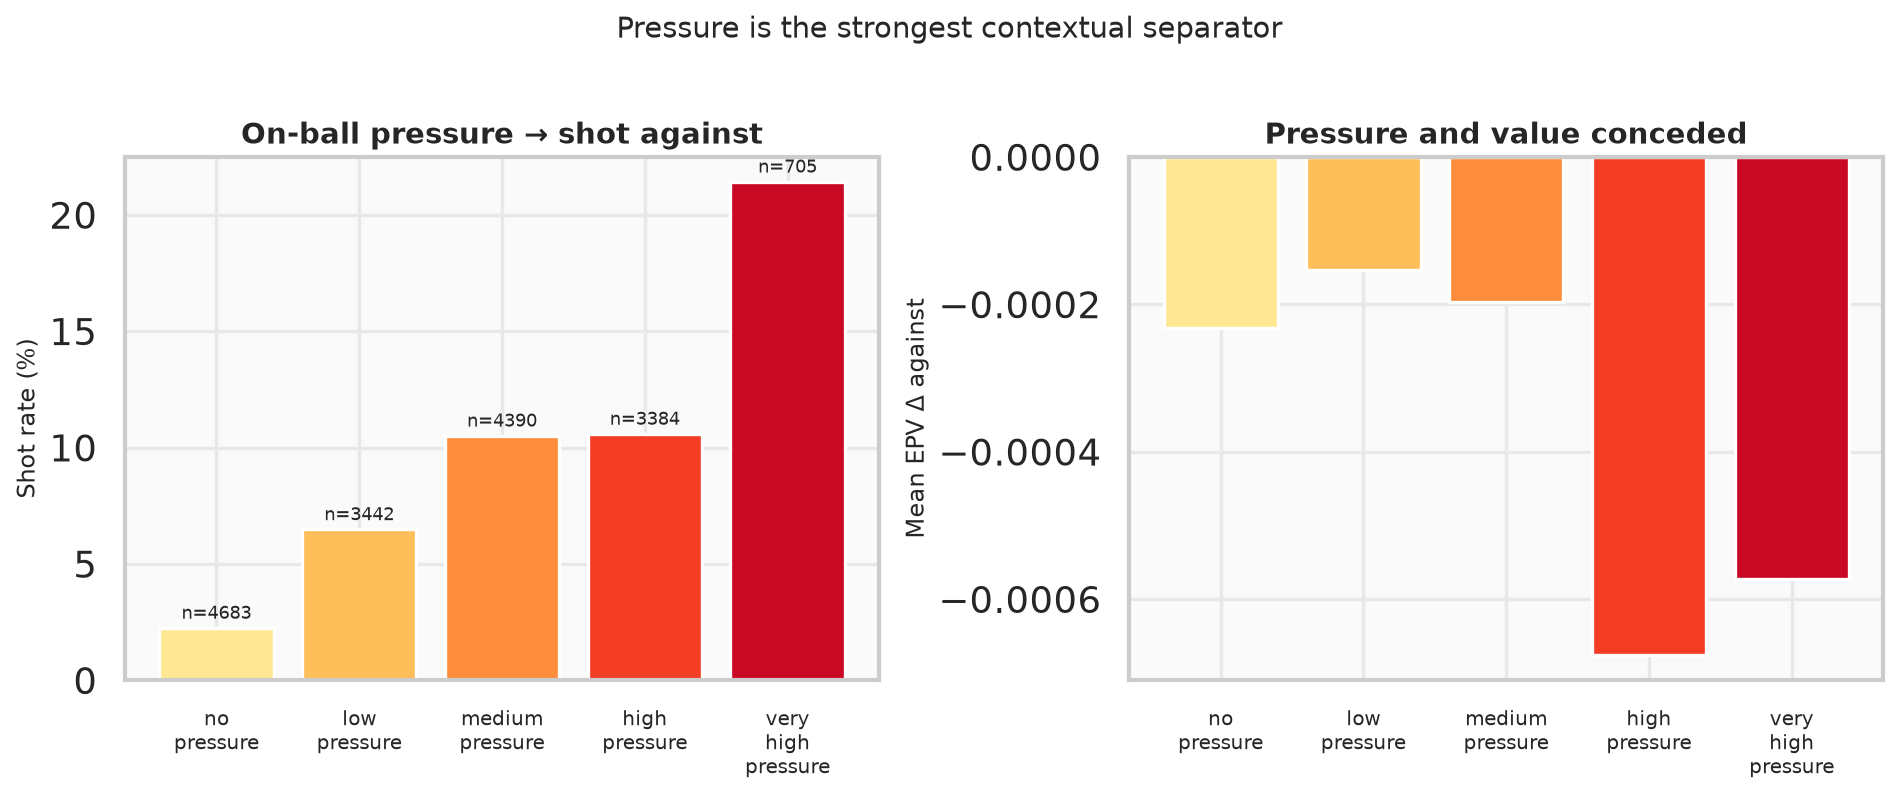
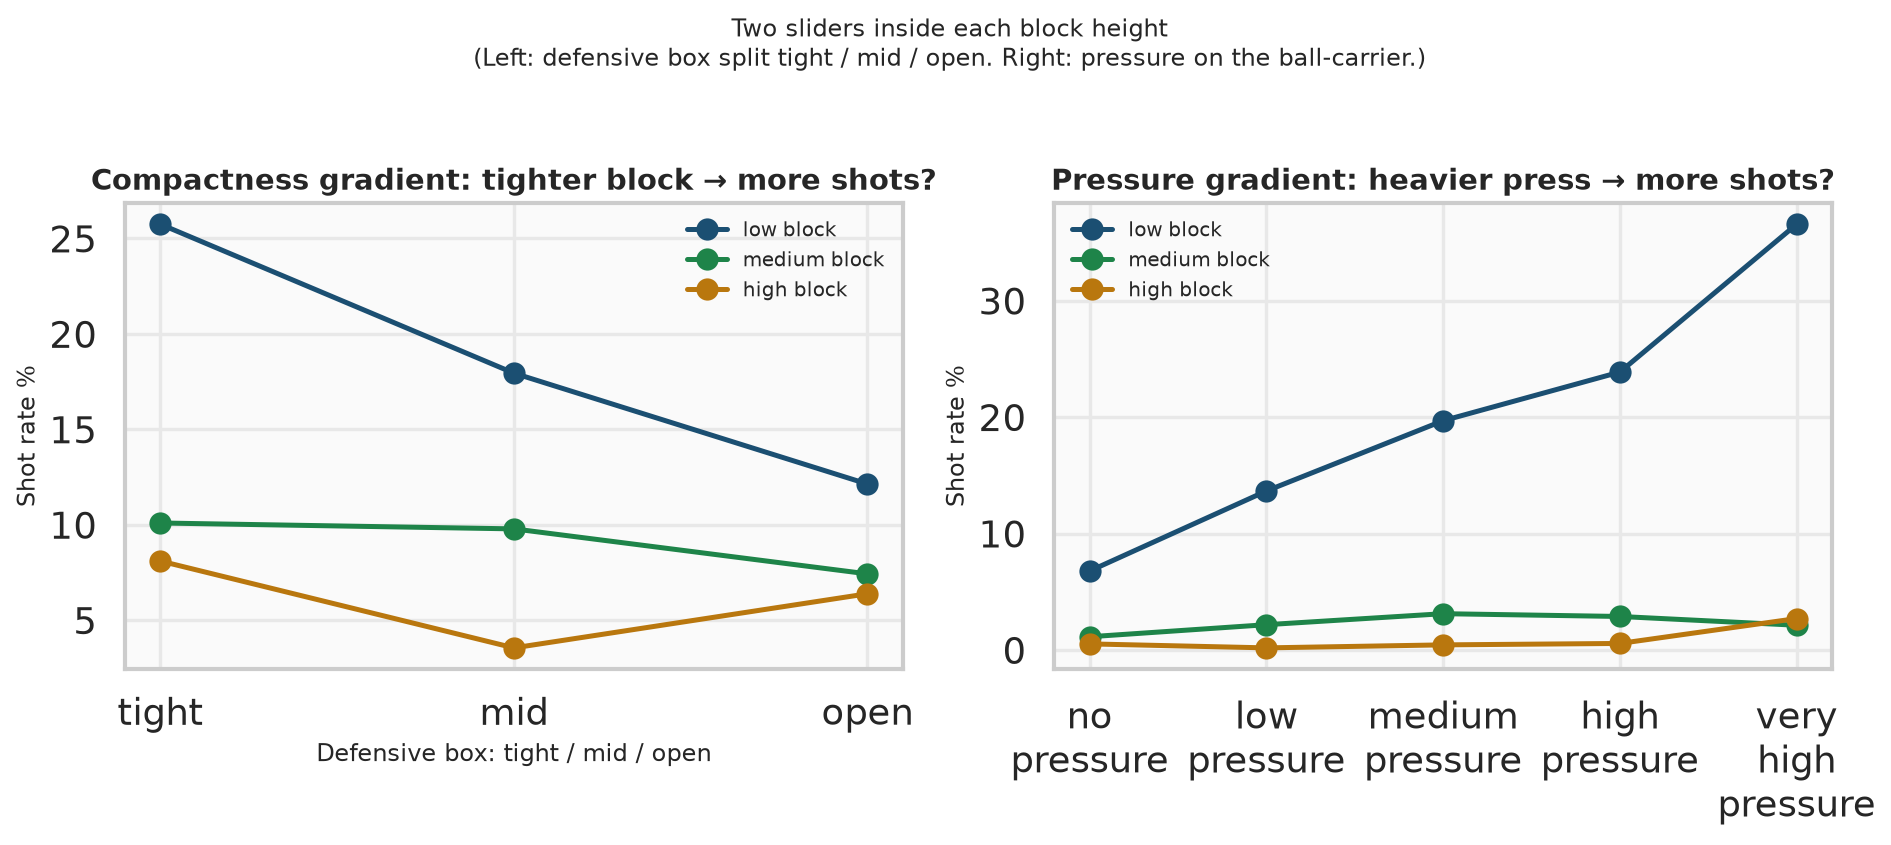
Pressure runs from 2.2% shots with none to 21.4% with very high pressure. High pressure often means the ball is already dangerous, so read it as context.
Box size
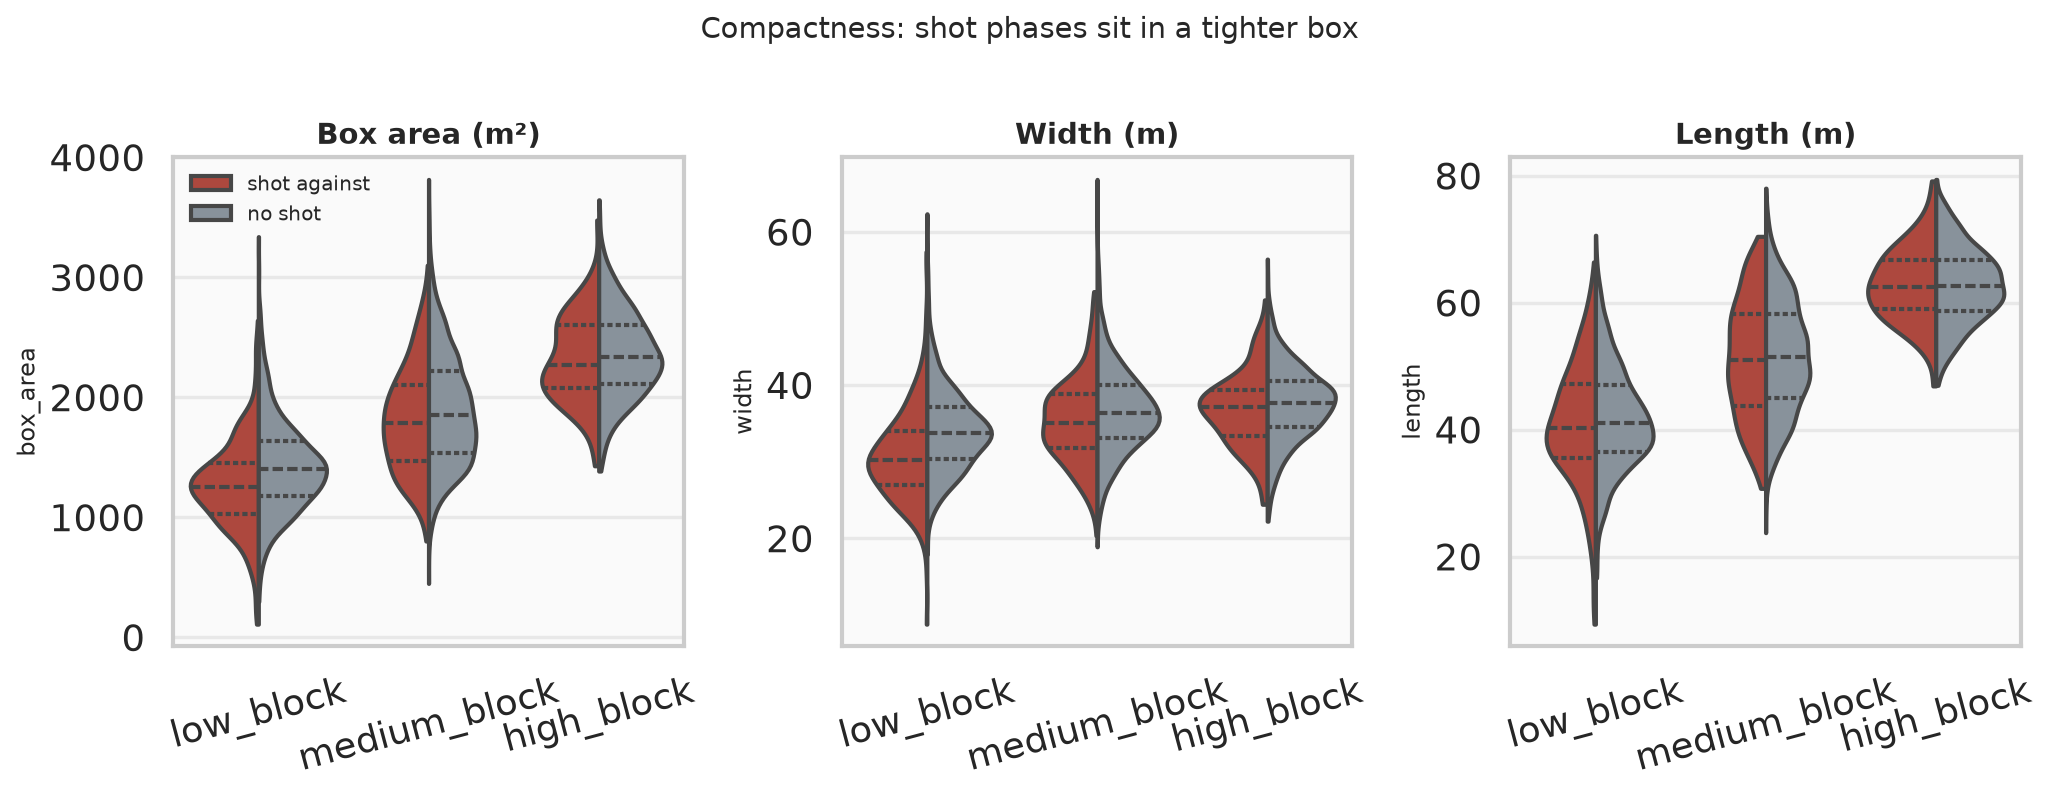
Shot phases have a smaller box, strongest in the low block (about 148–166 m²).
From the earlier review
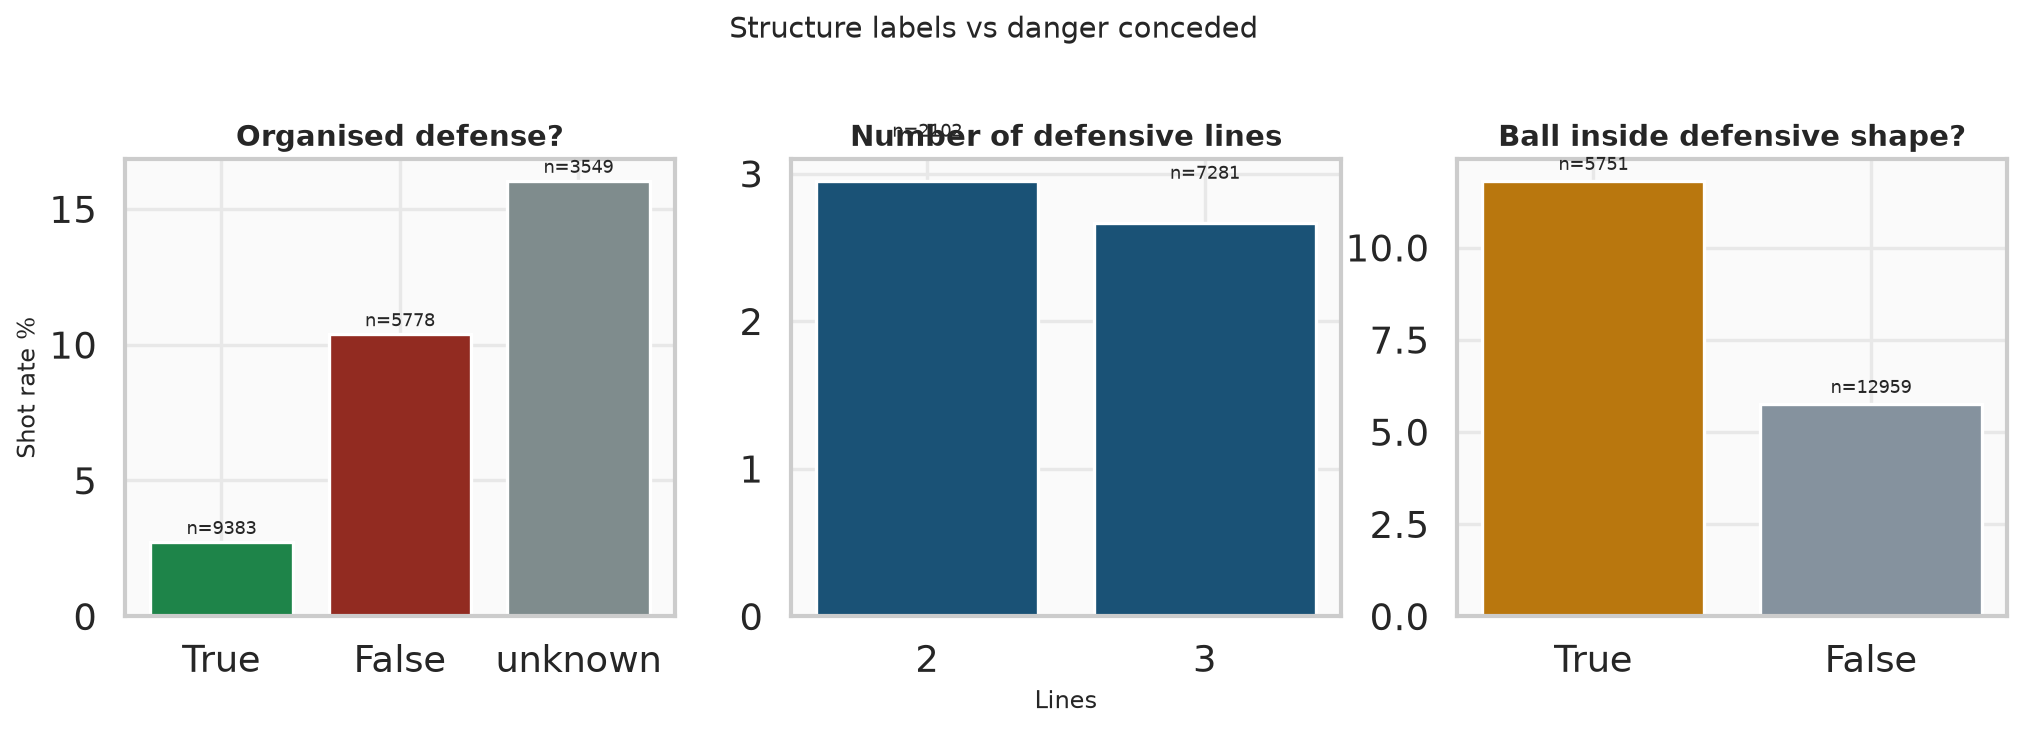
Organised defense is about a 2.5% shot rate, versus about 10.5% when it is not. The ball inside the shape is about 11.5%, versus about 5.8% outside.
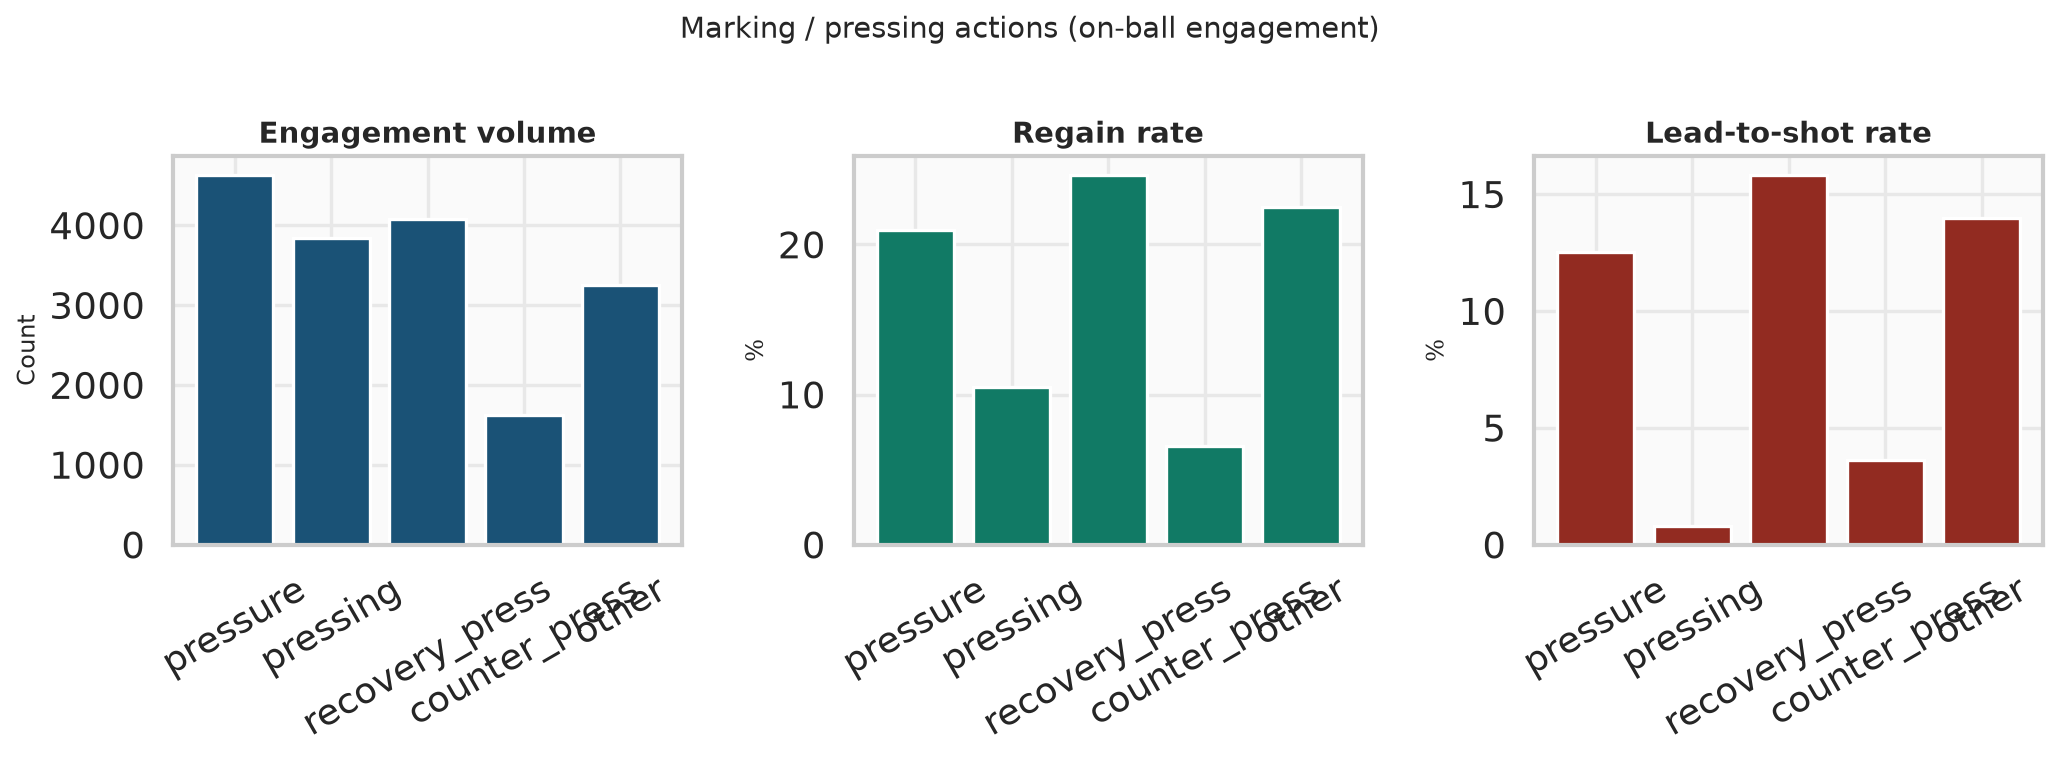
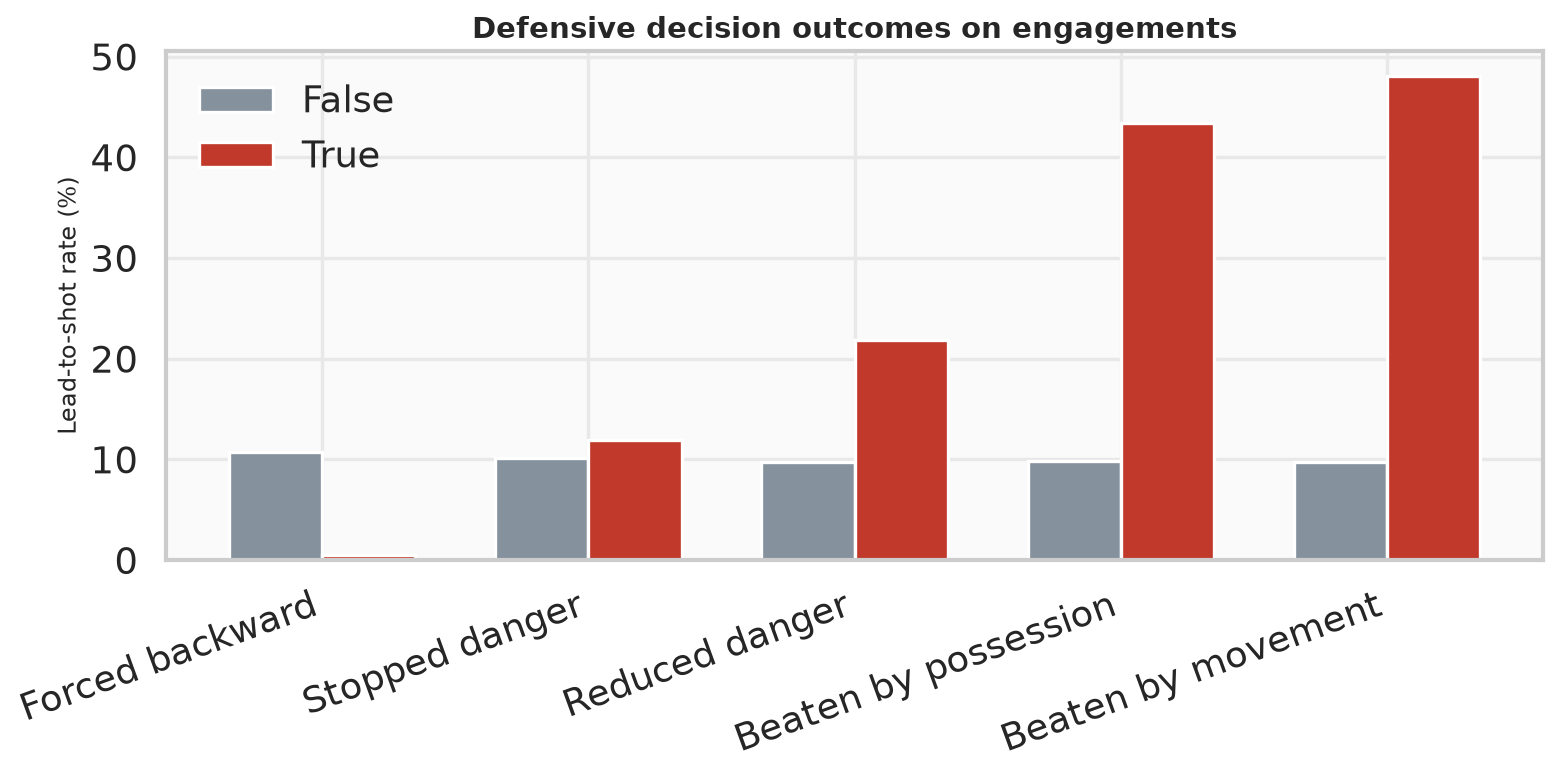
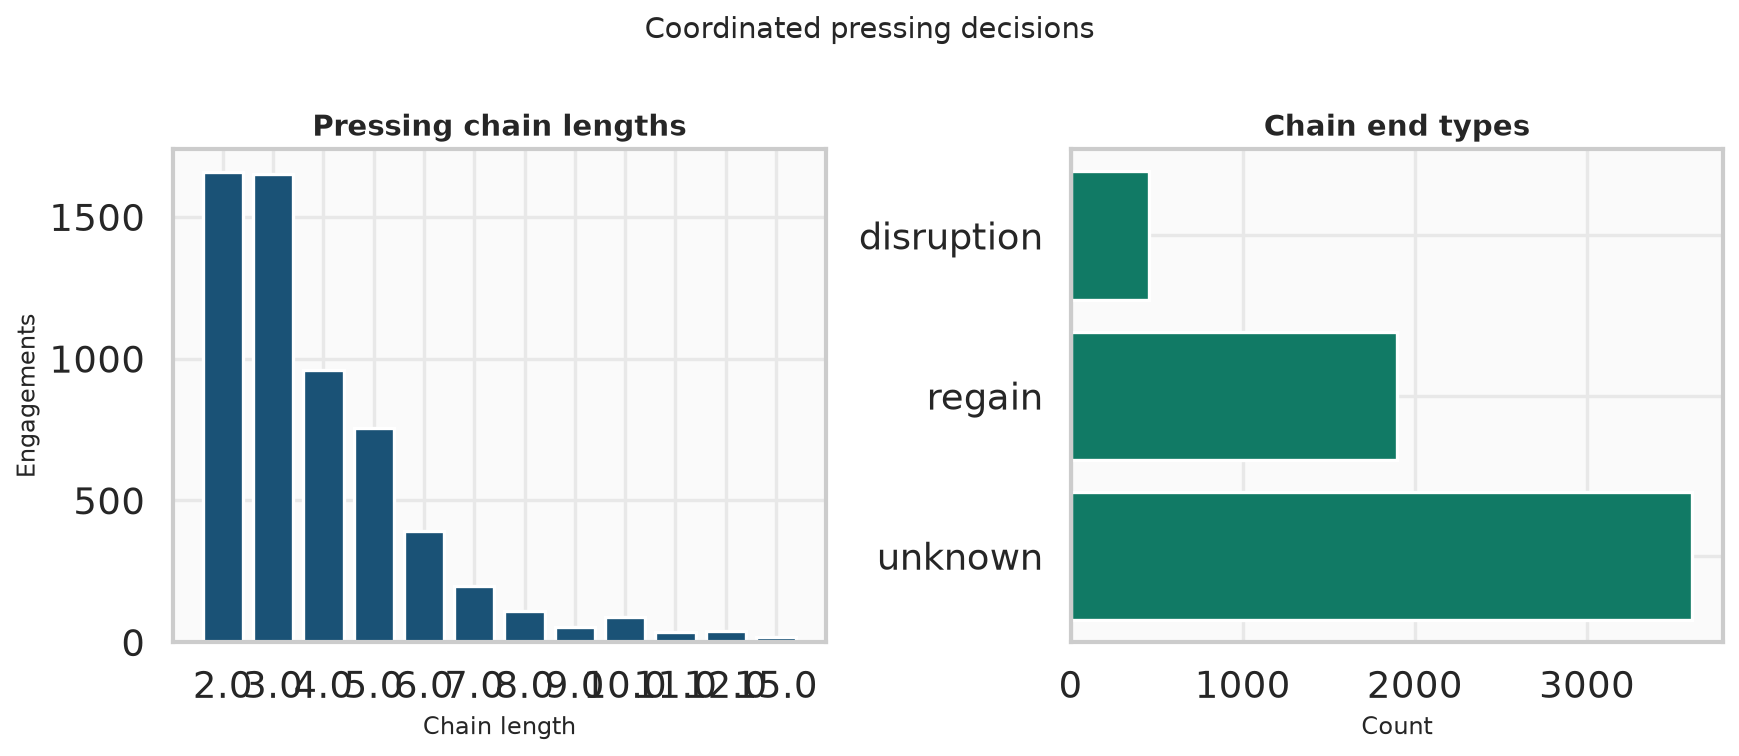
Pressing and counter-press regain the ball more often. Beaten-by-possession and beaten-by-movement flags precede shots.
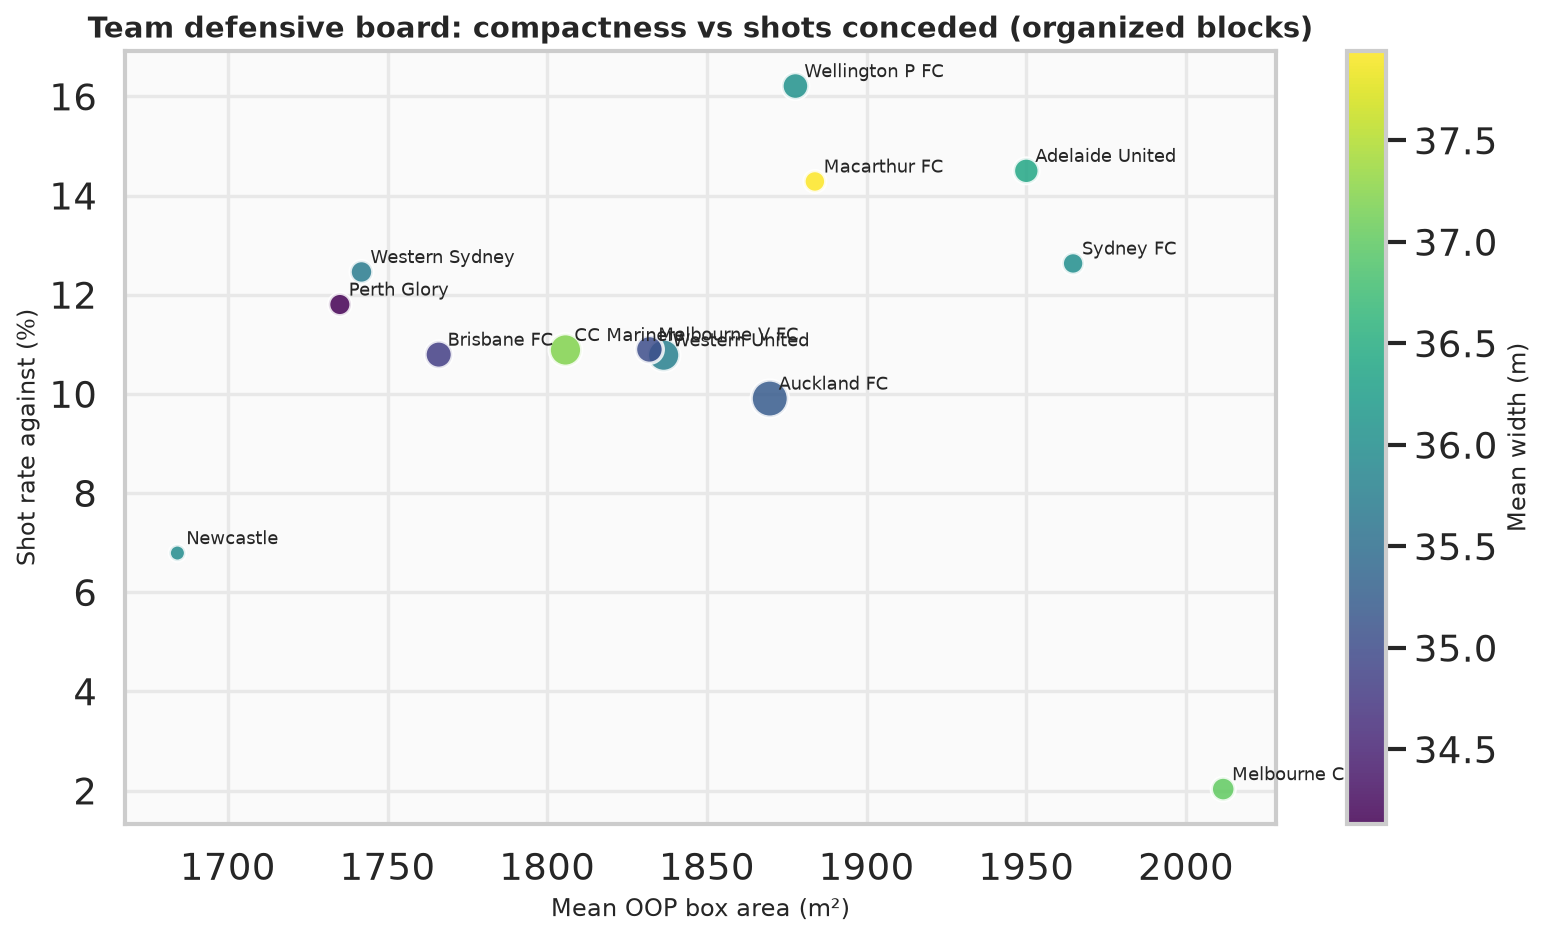
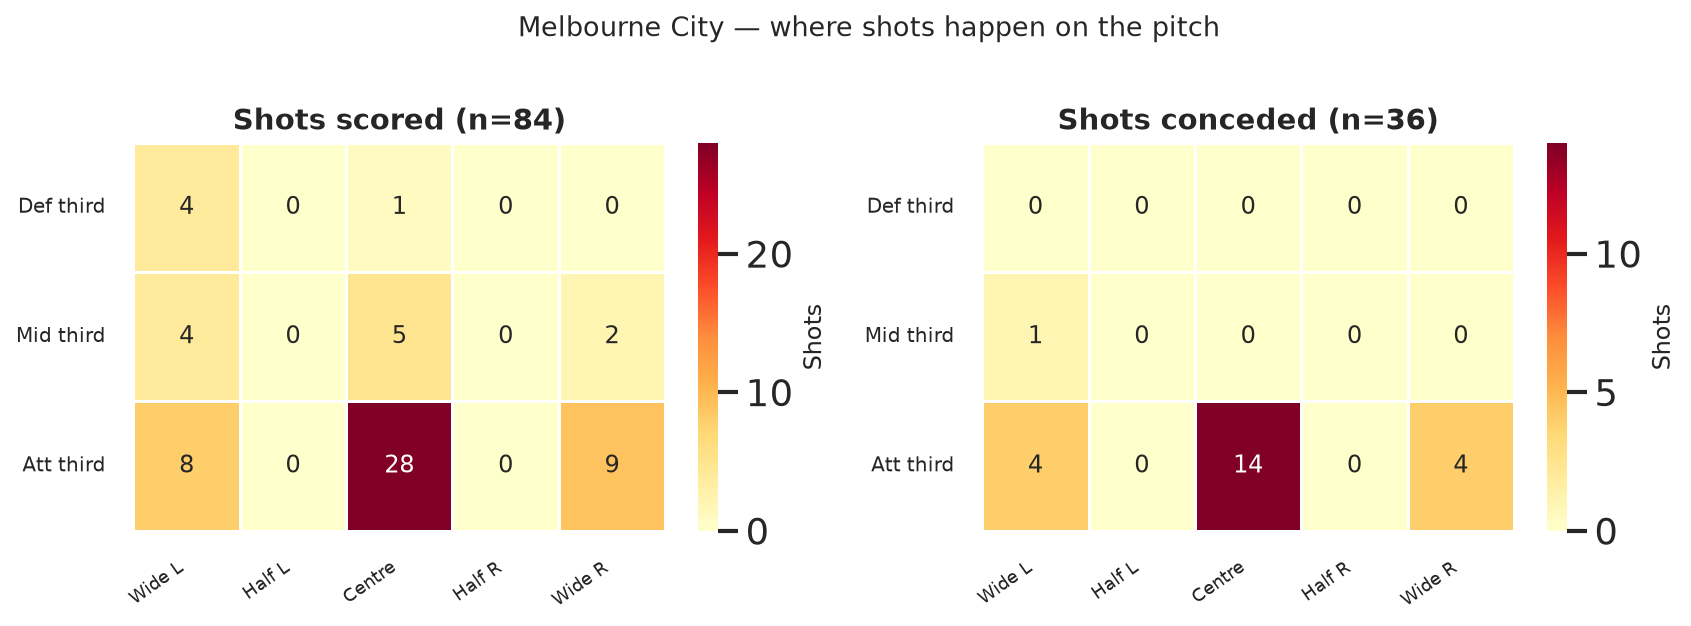
Mean out-of-possession box area alone does not rank shot prevention. Melbourne City is a large box with a low shot rate.
The box already measures compactness. The open question is who steps, who holds, and when the block slides versus jumps.
Film the spells where pressure is high and the box is open. Those are the decision mistakes, not the average pressure ladder.
The question underneath the charts: how tracking and contextual data explain the way players and teams defend. Shape, spacing, pressure, compactness, marking, and defensive decisions.
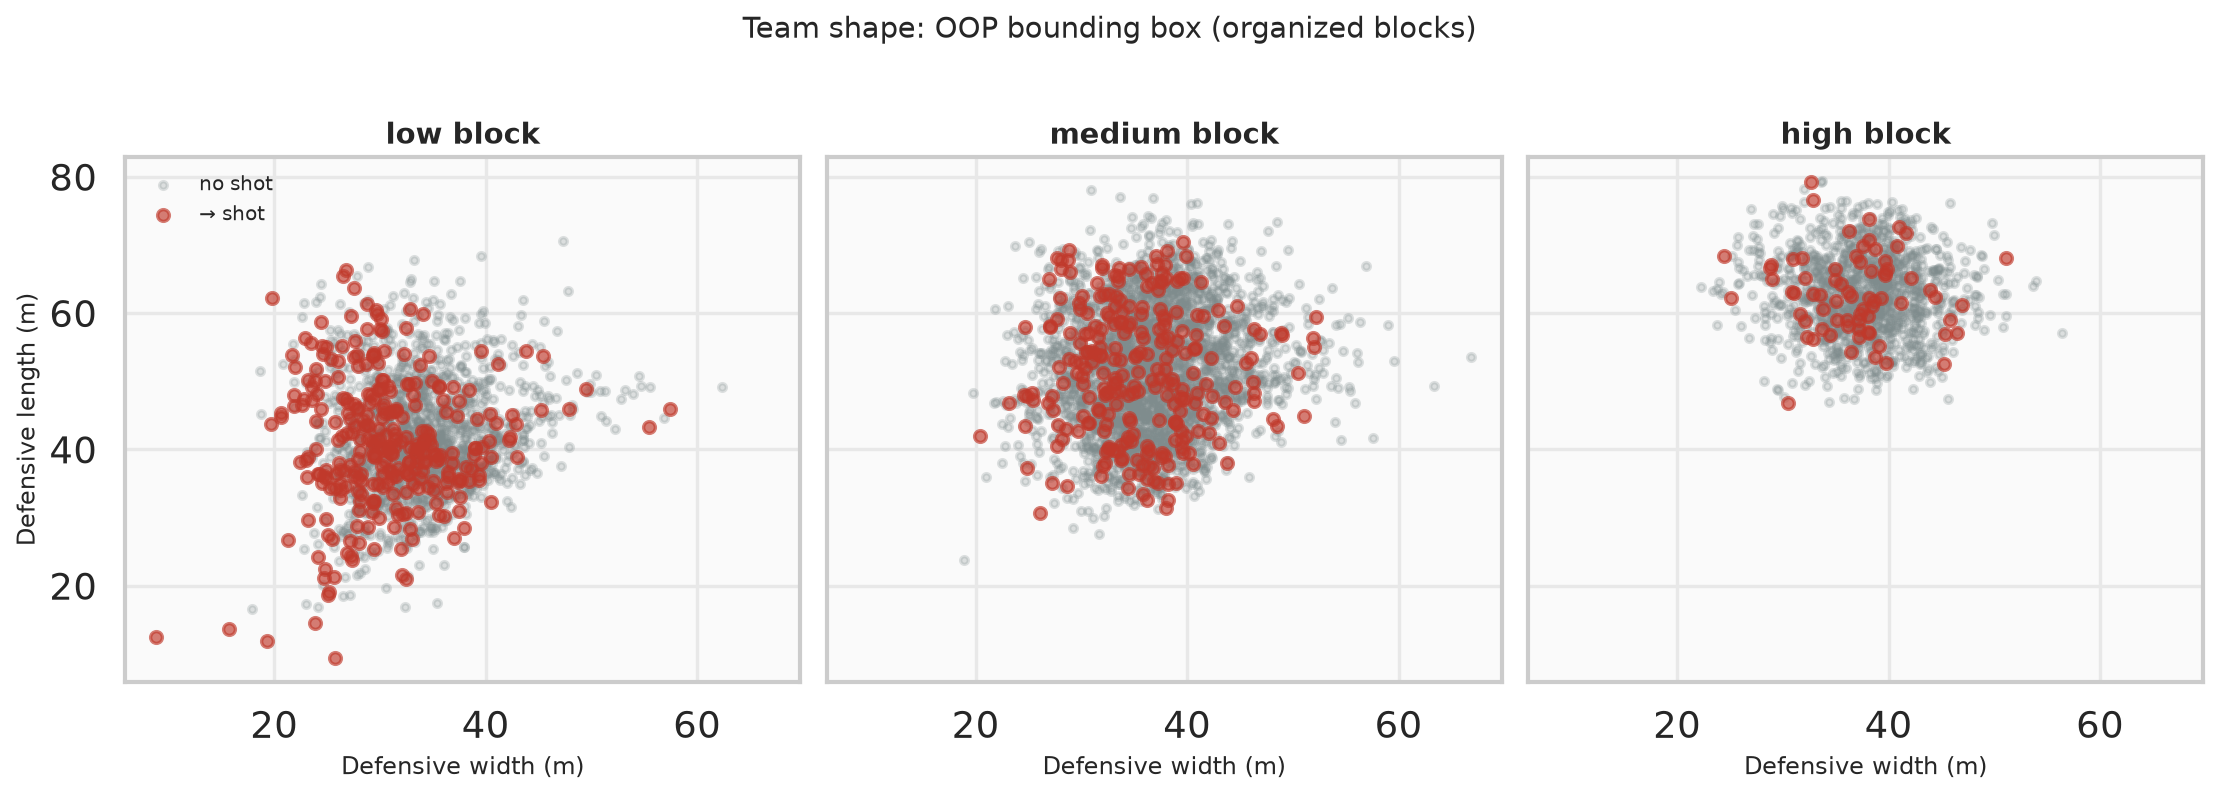
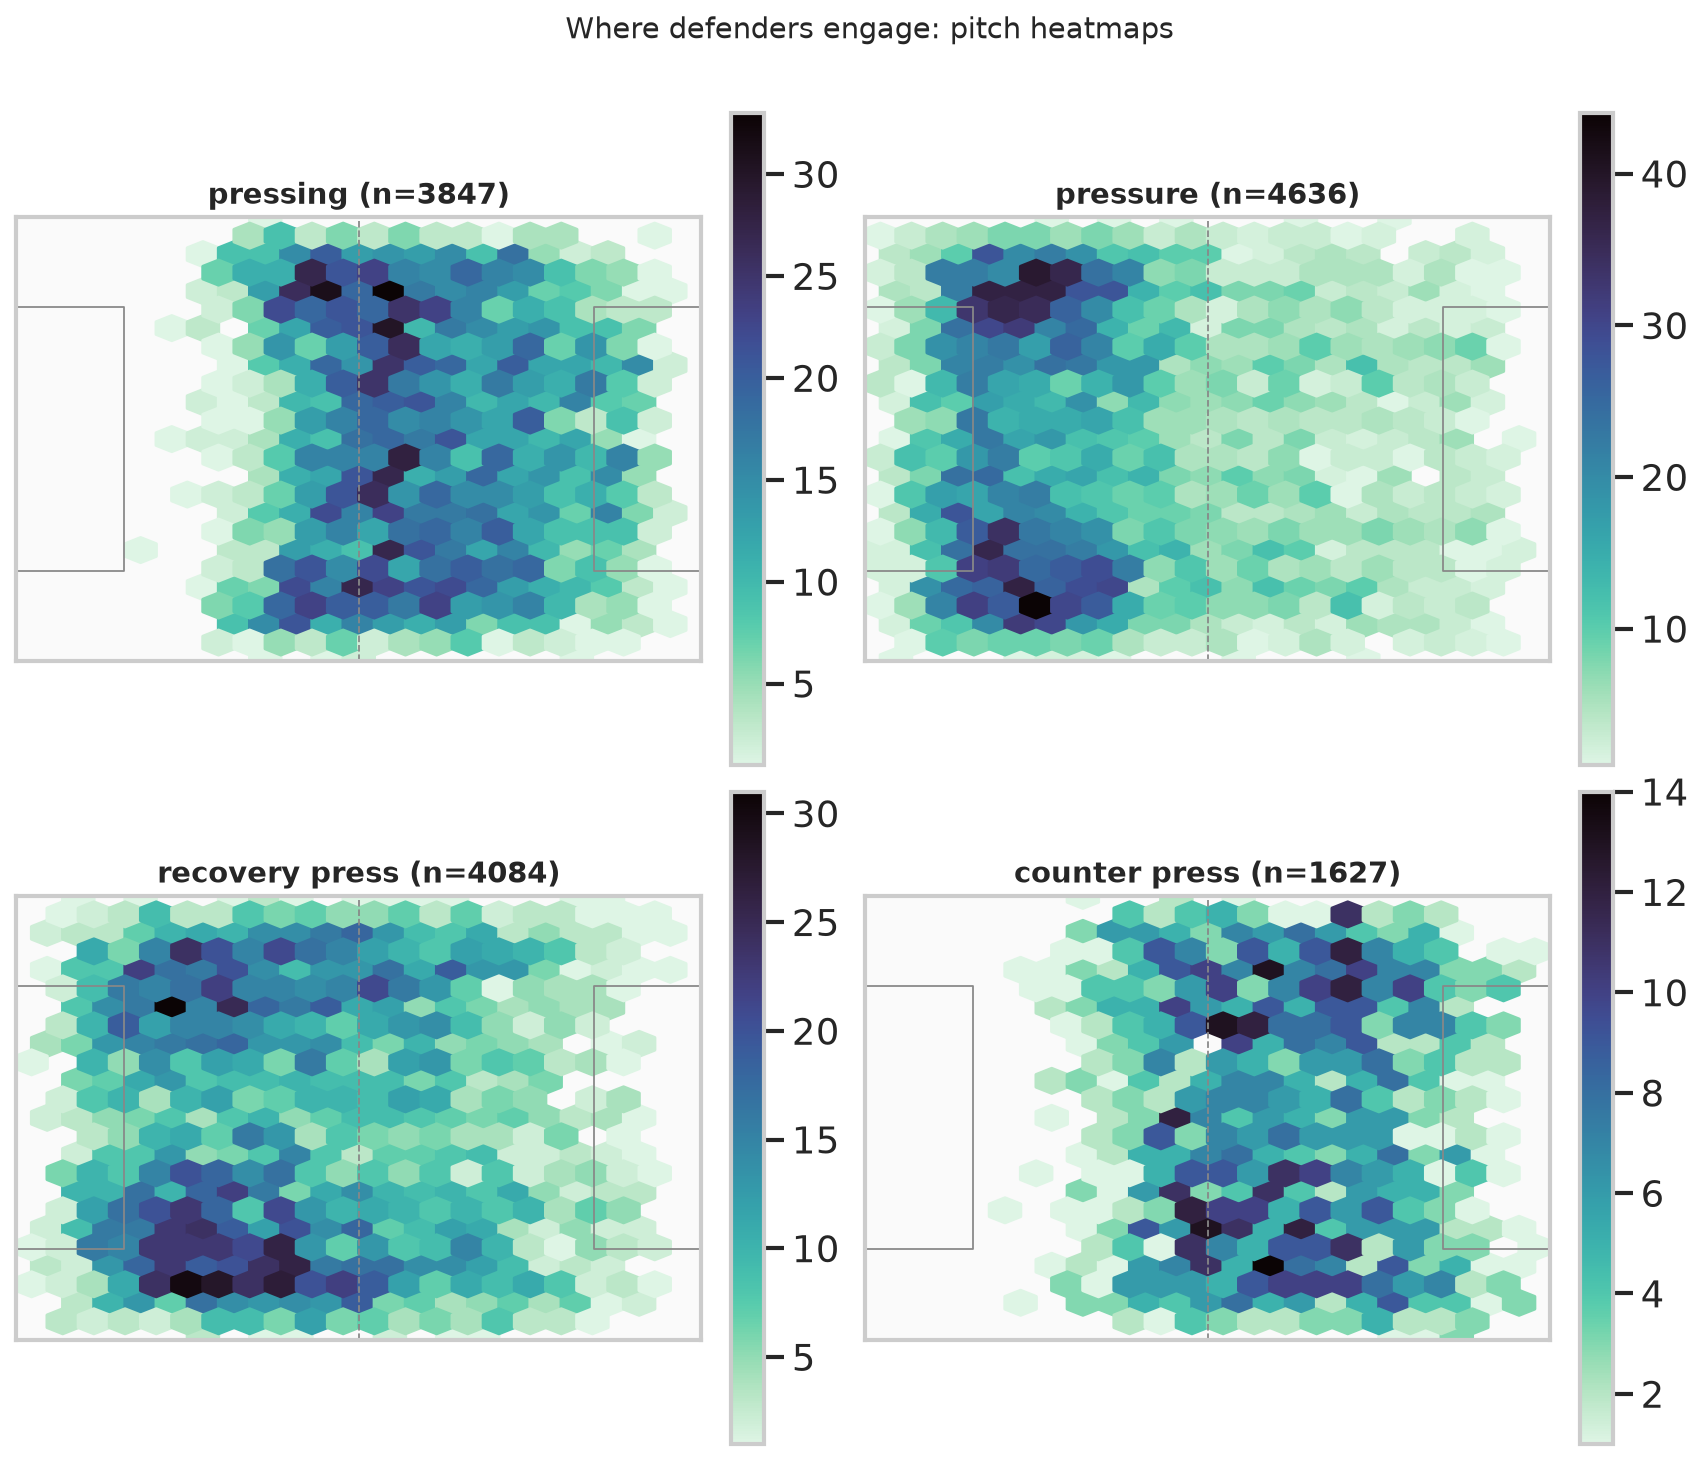
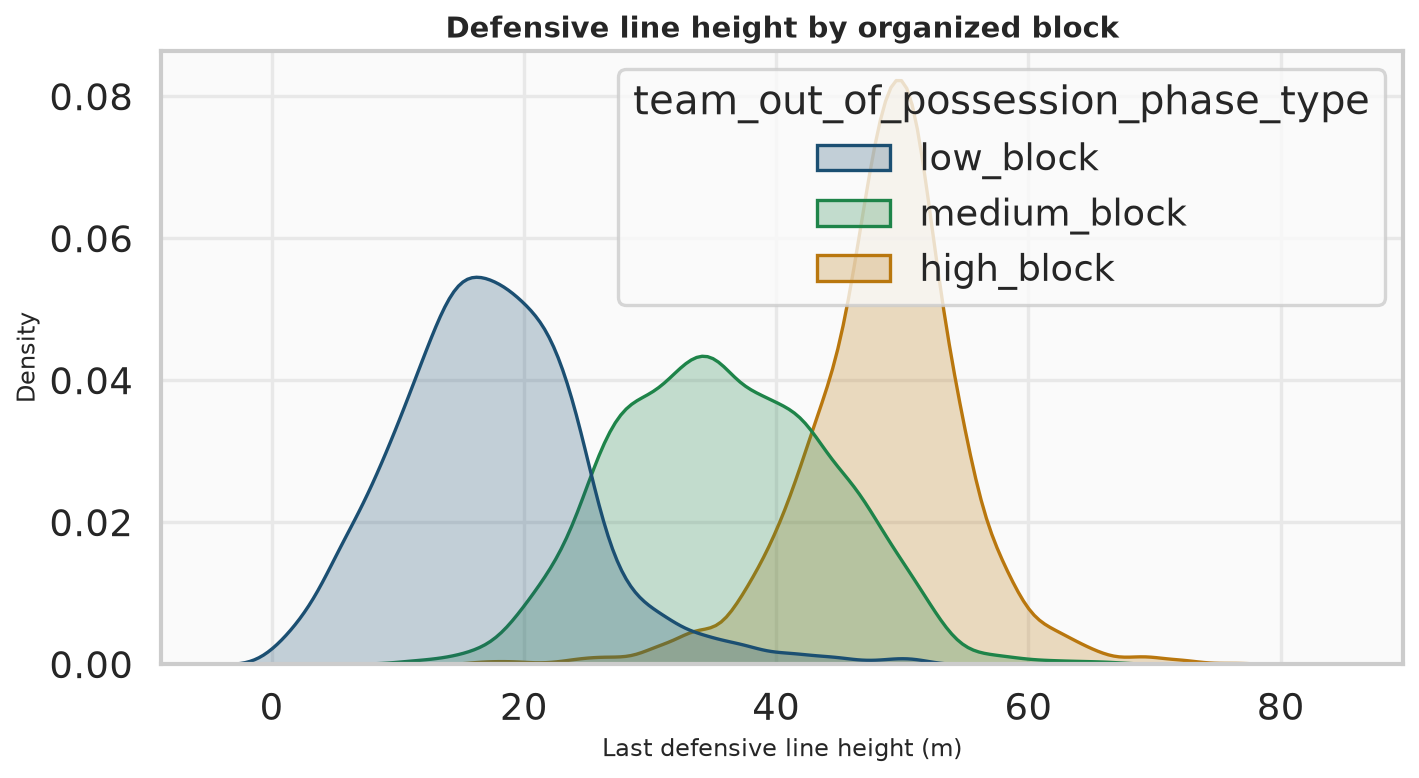
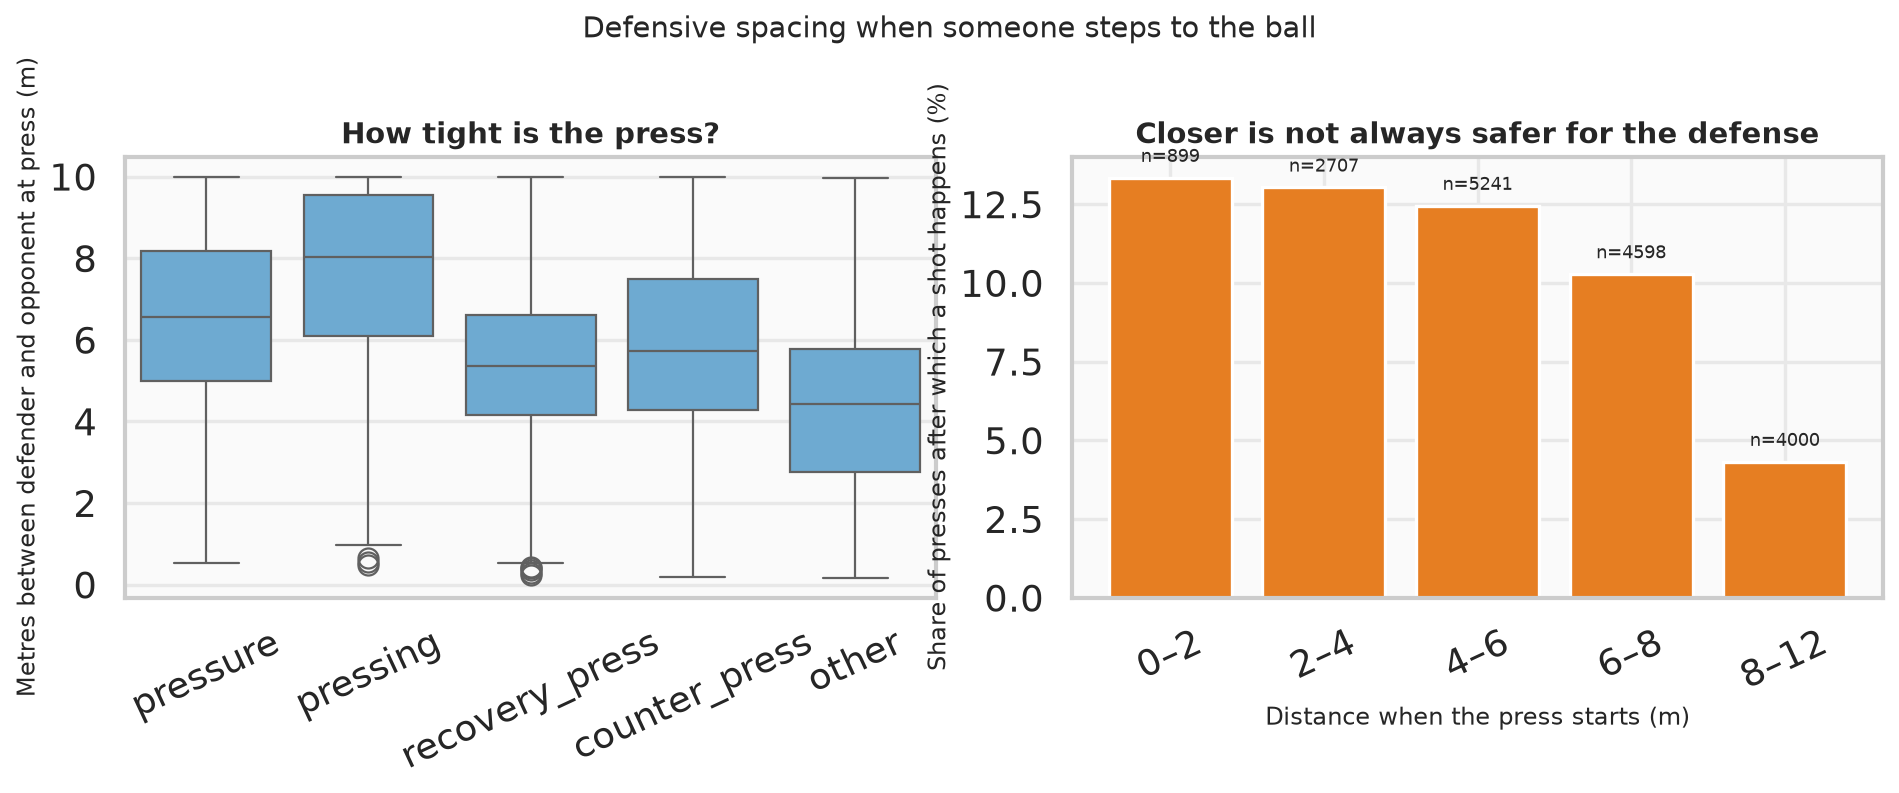
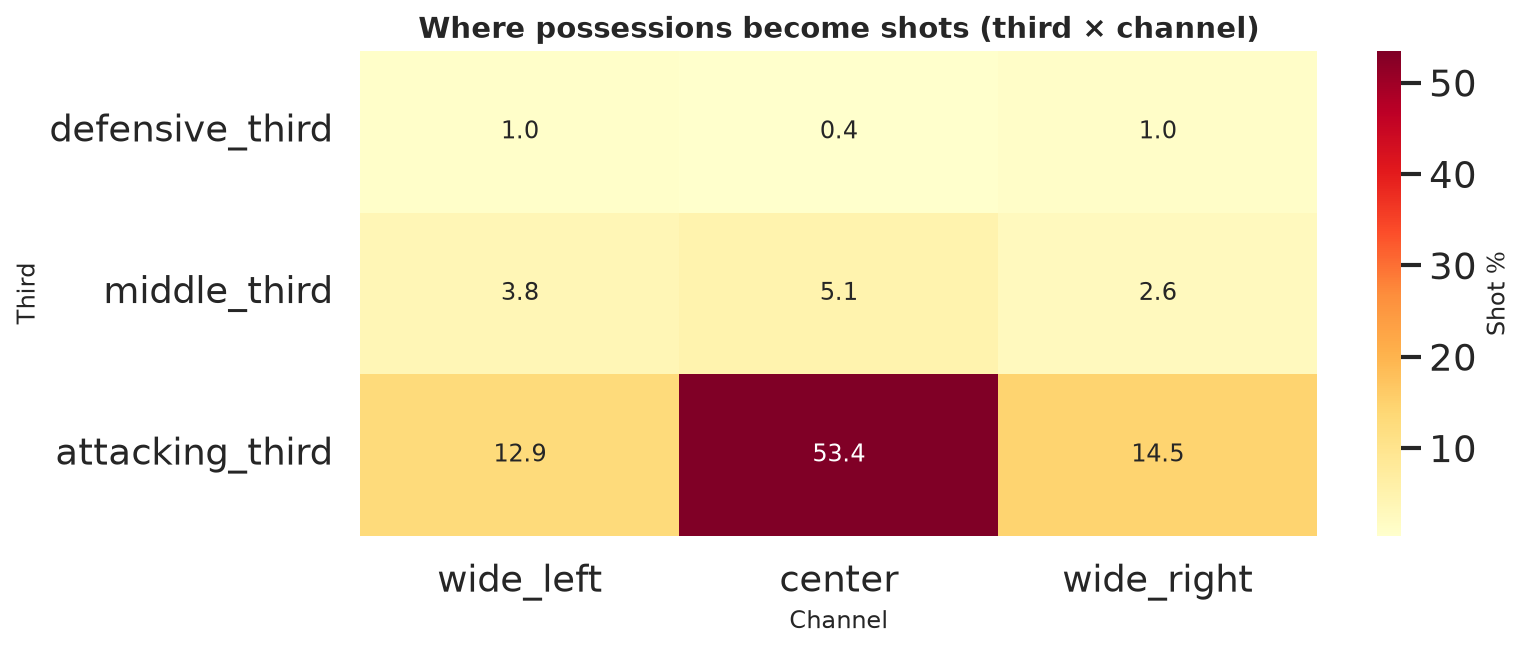
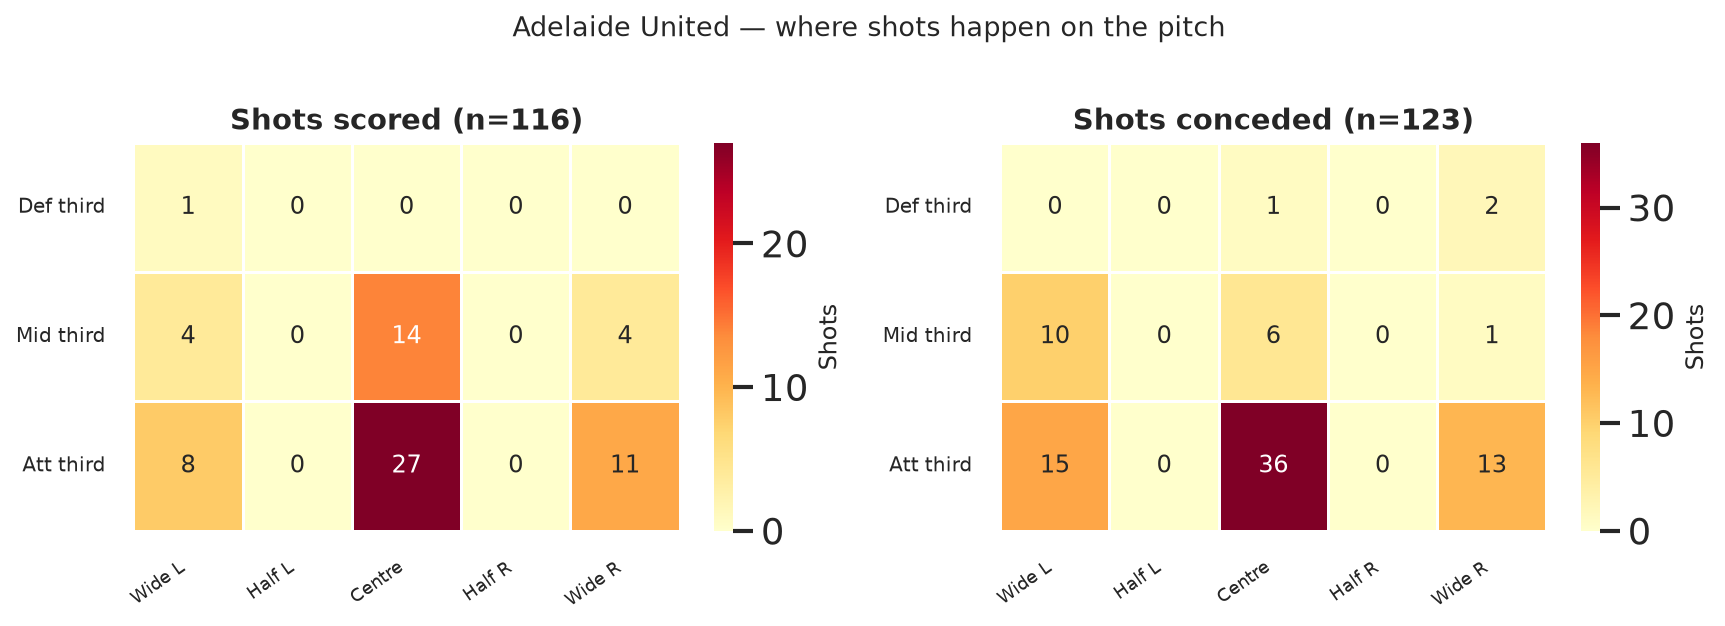
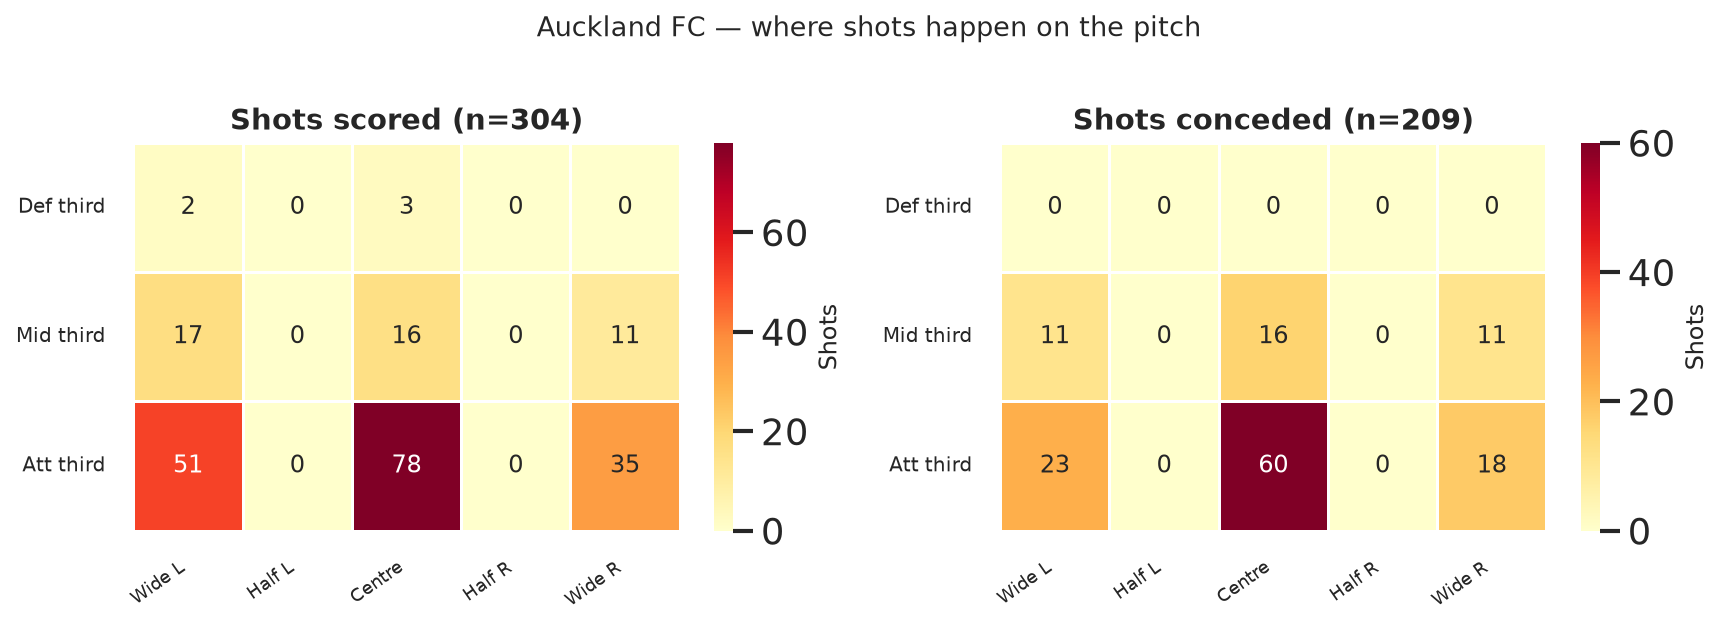
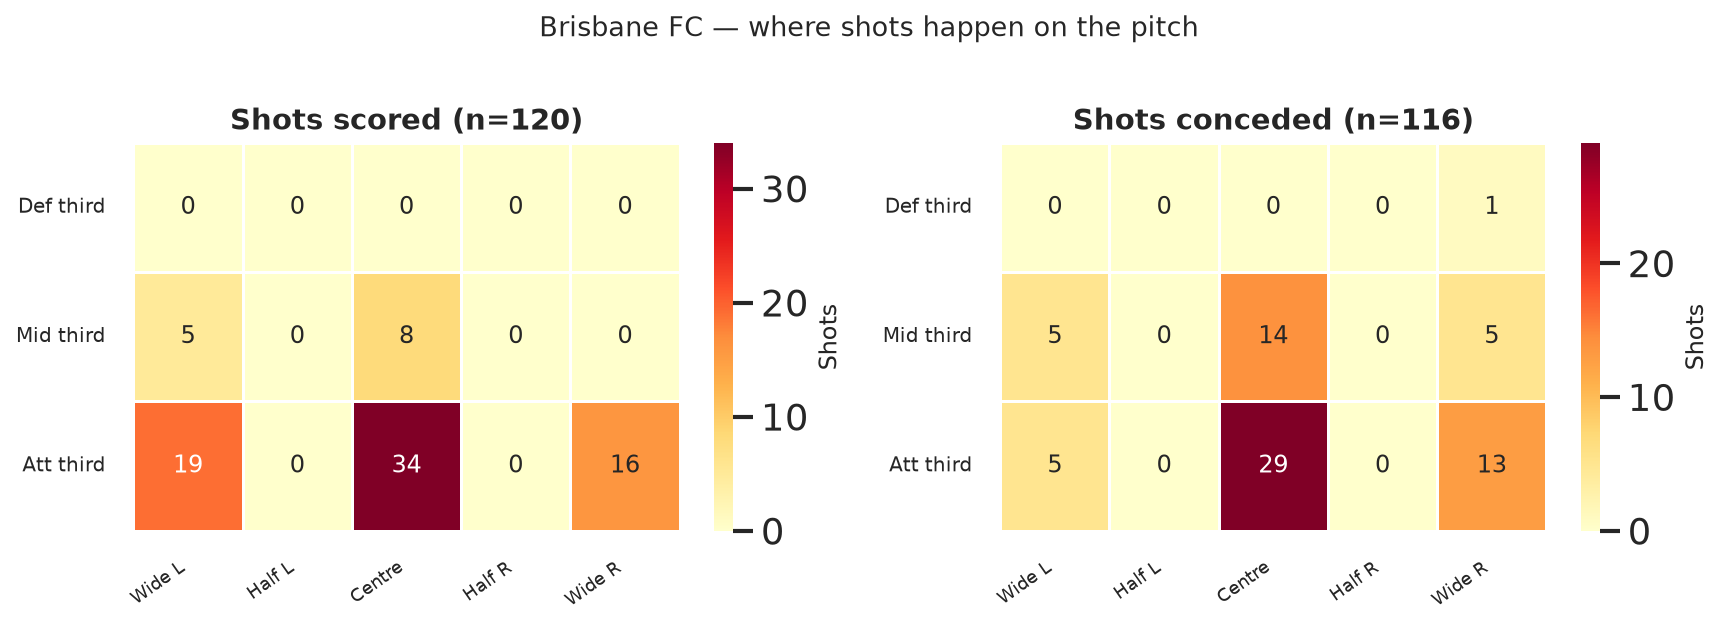
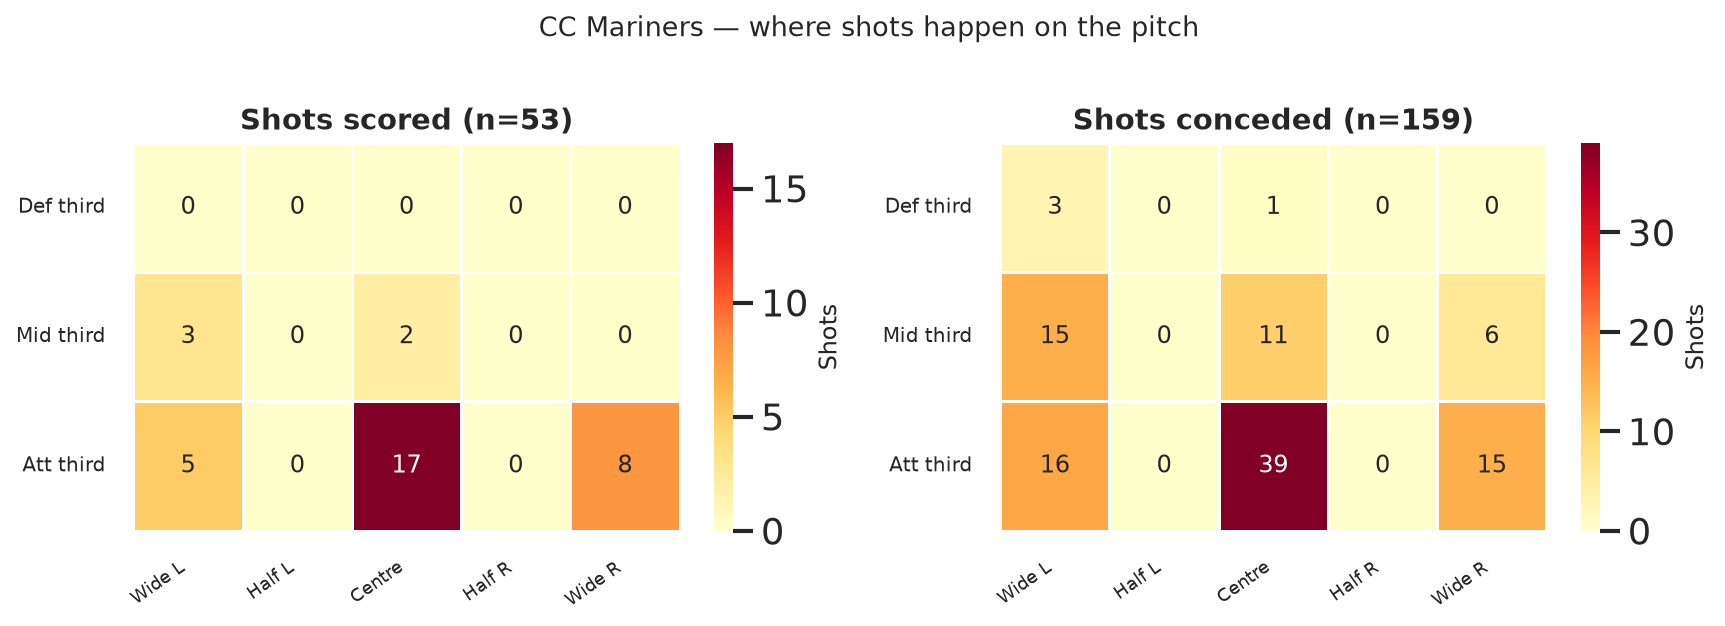
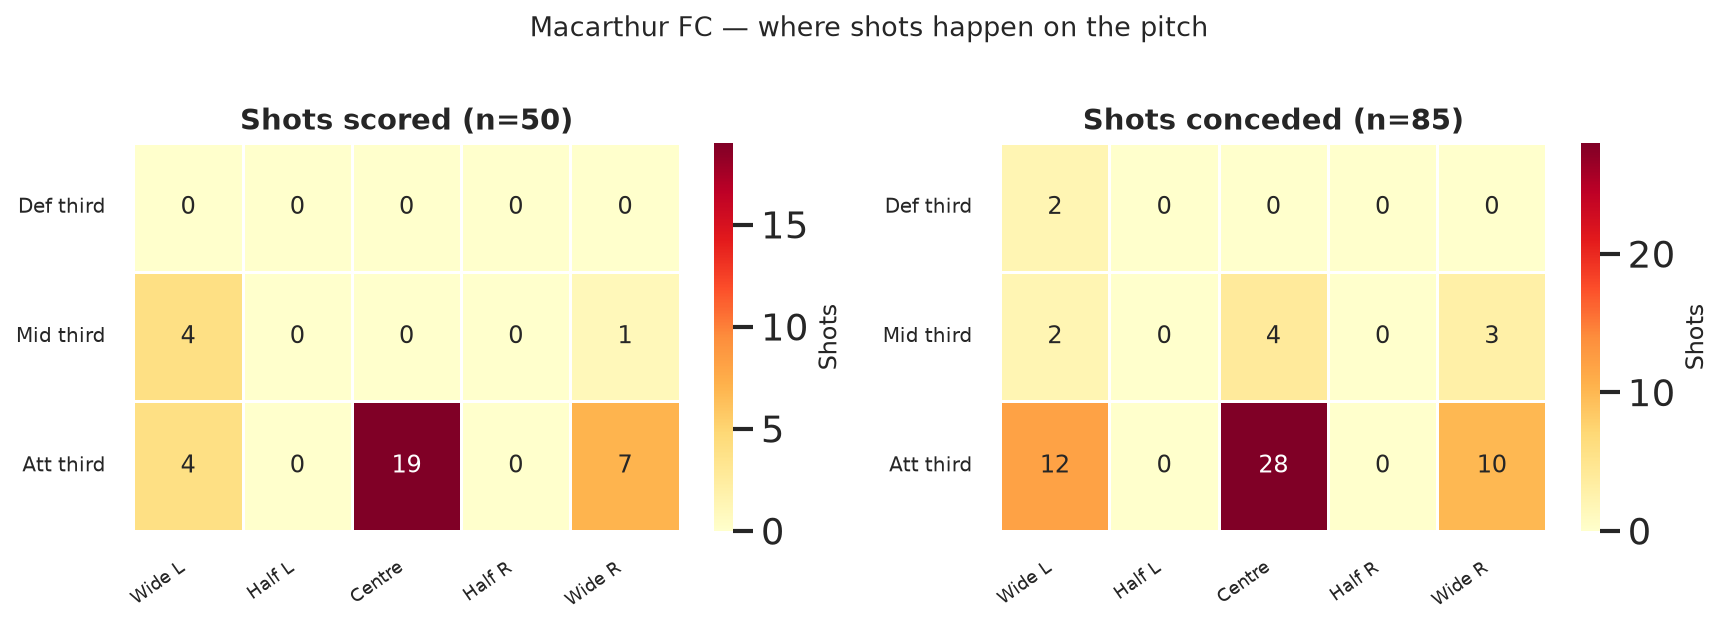
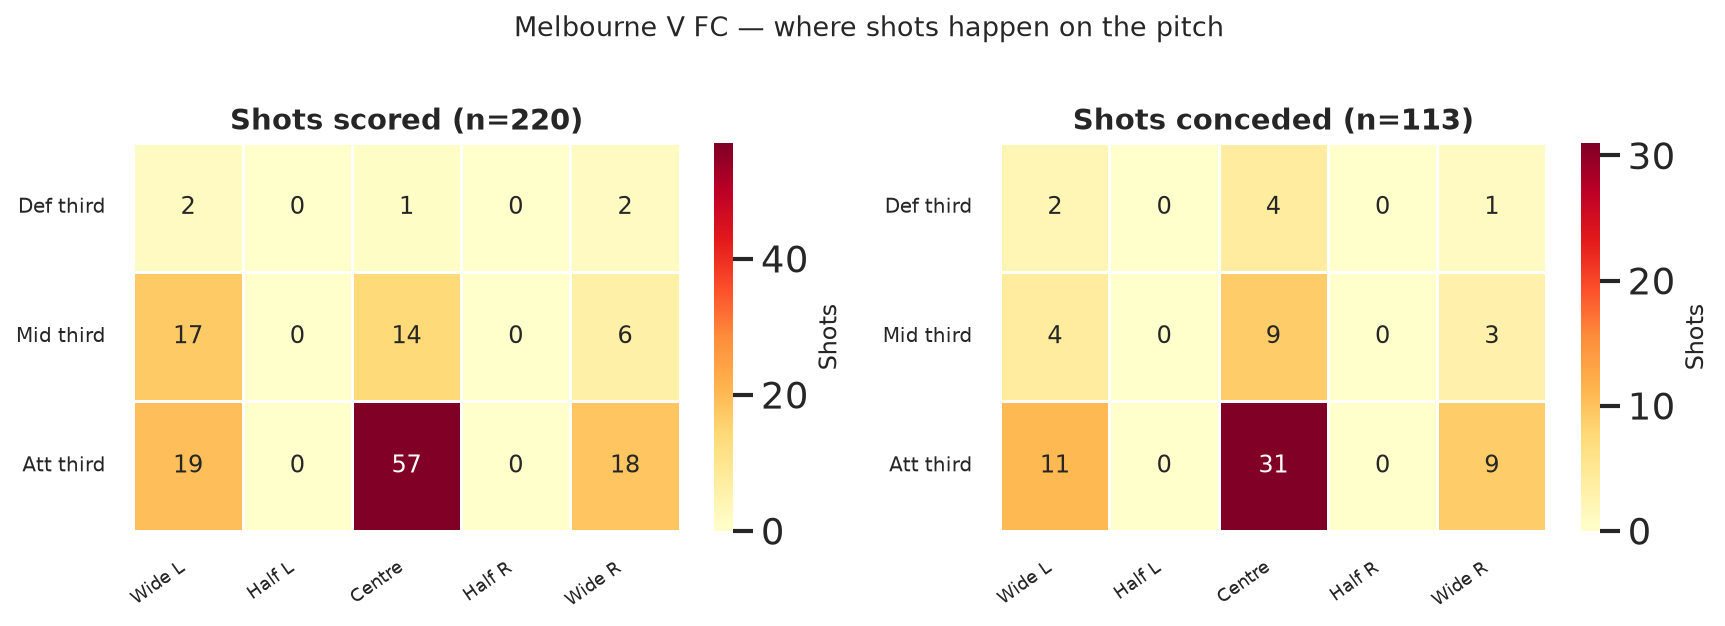
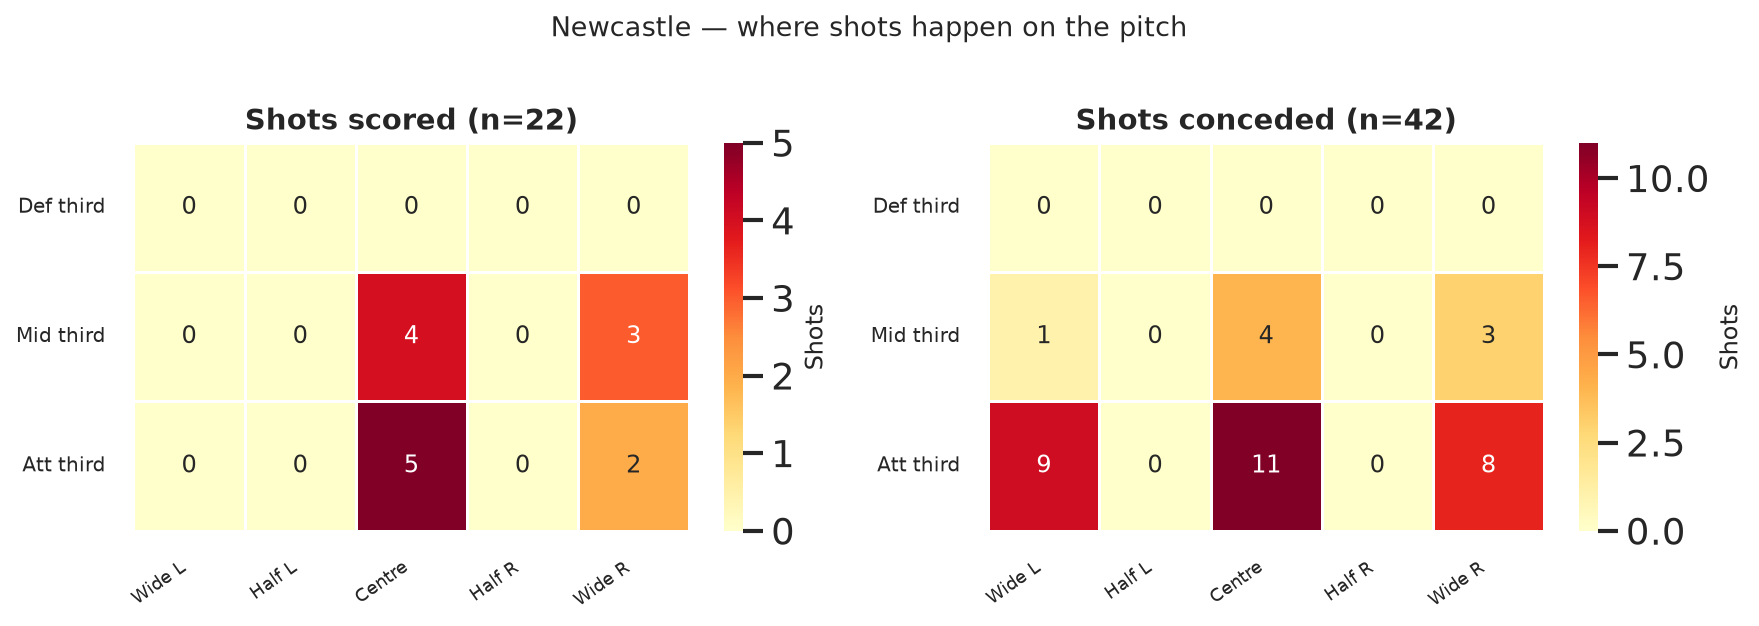
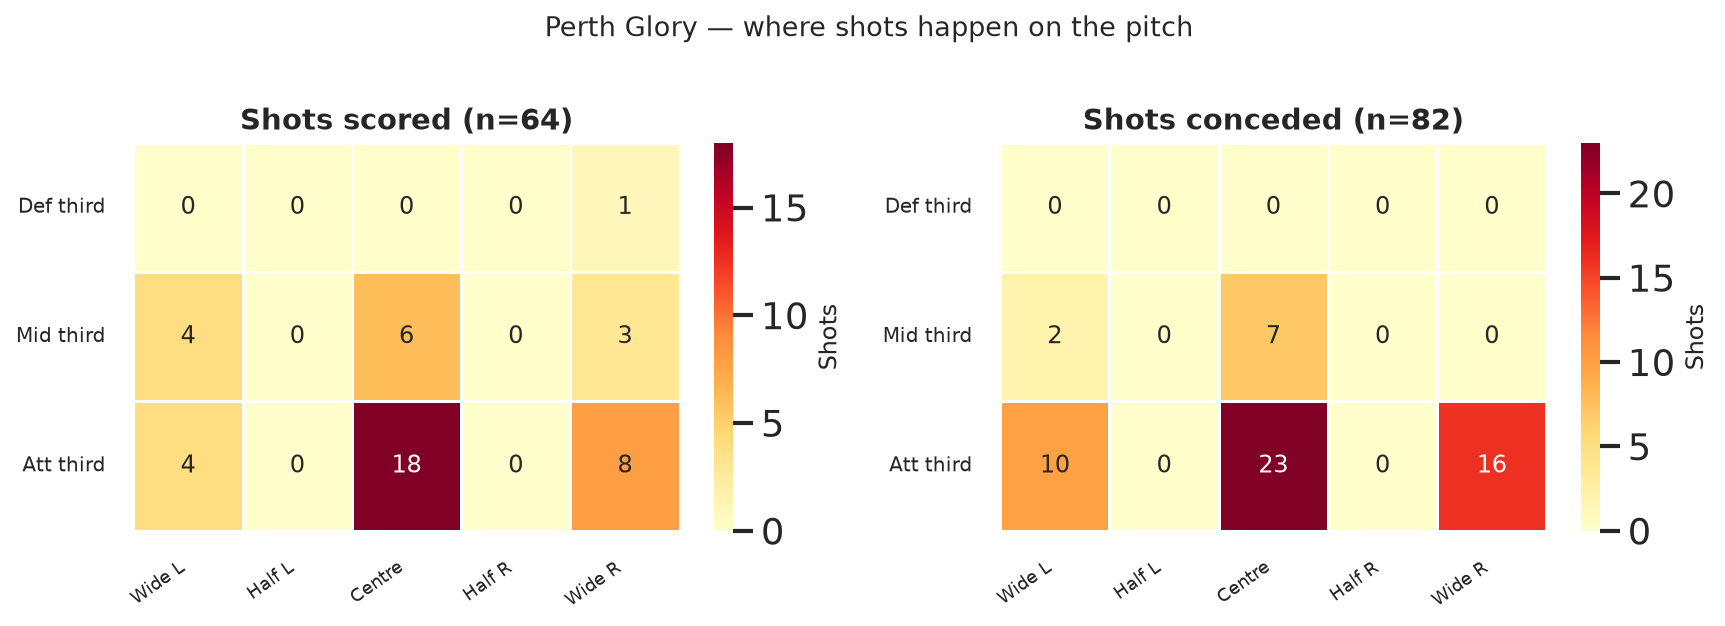
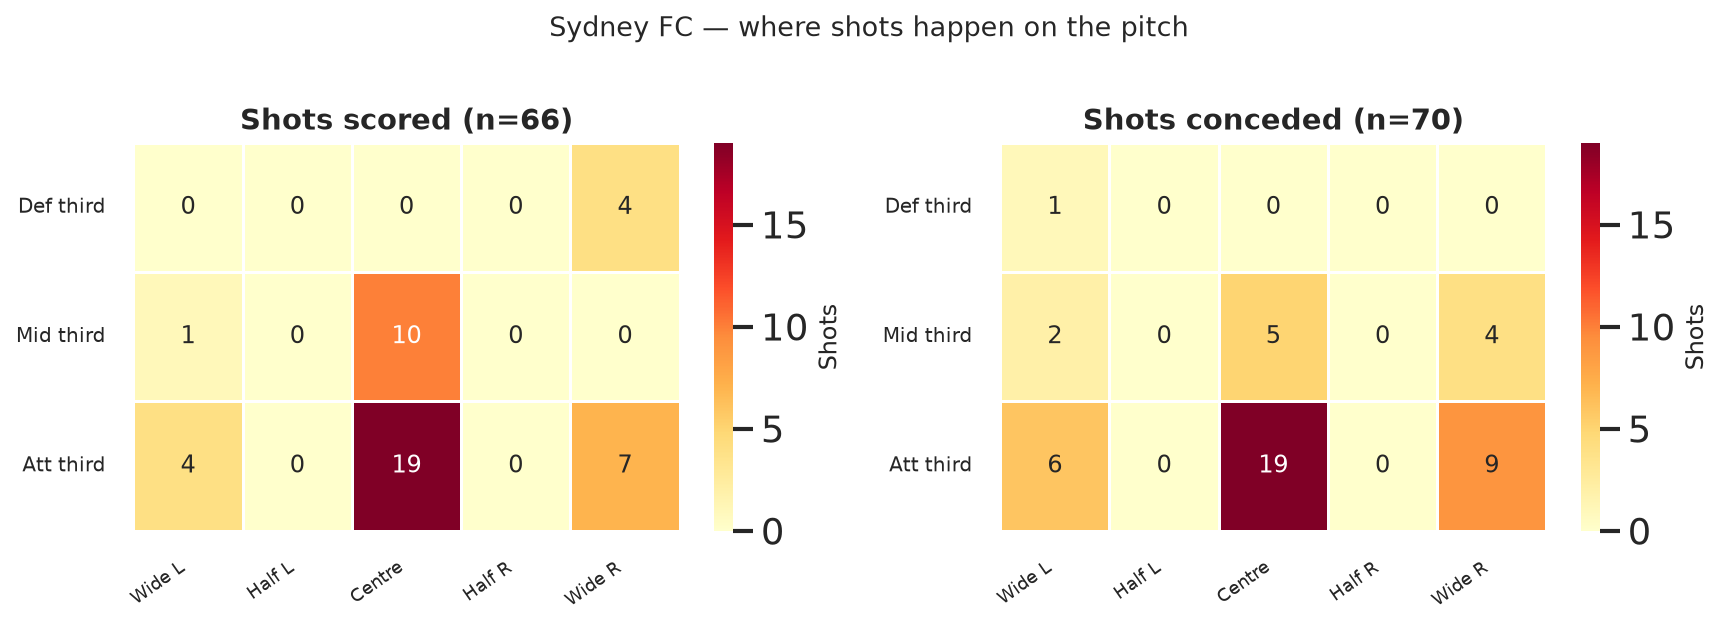
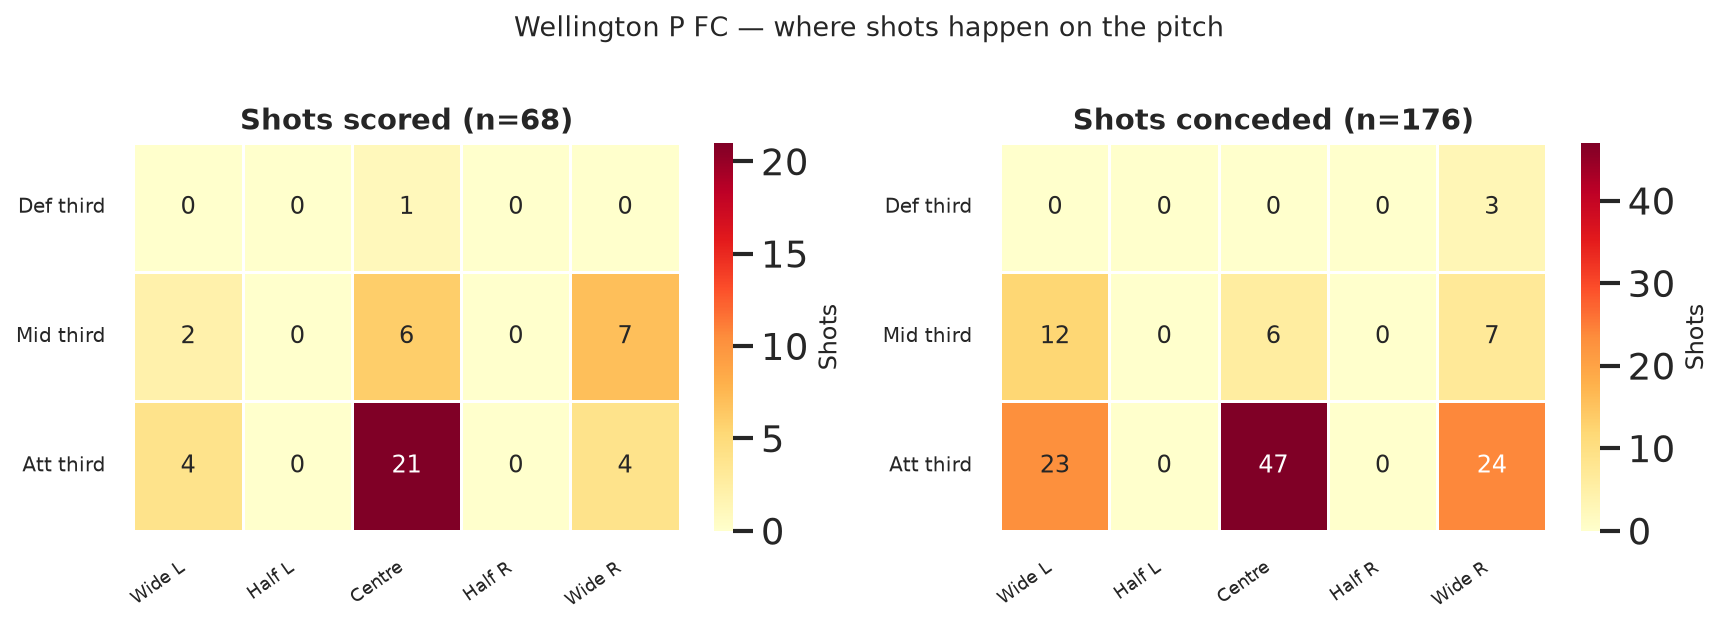
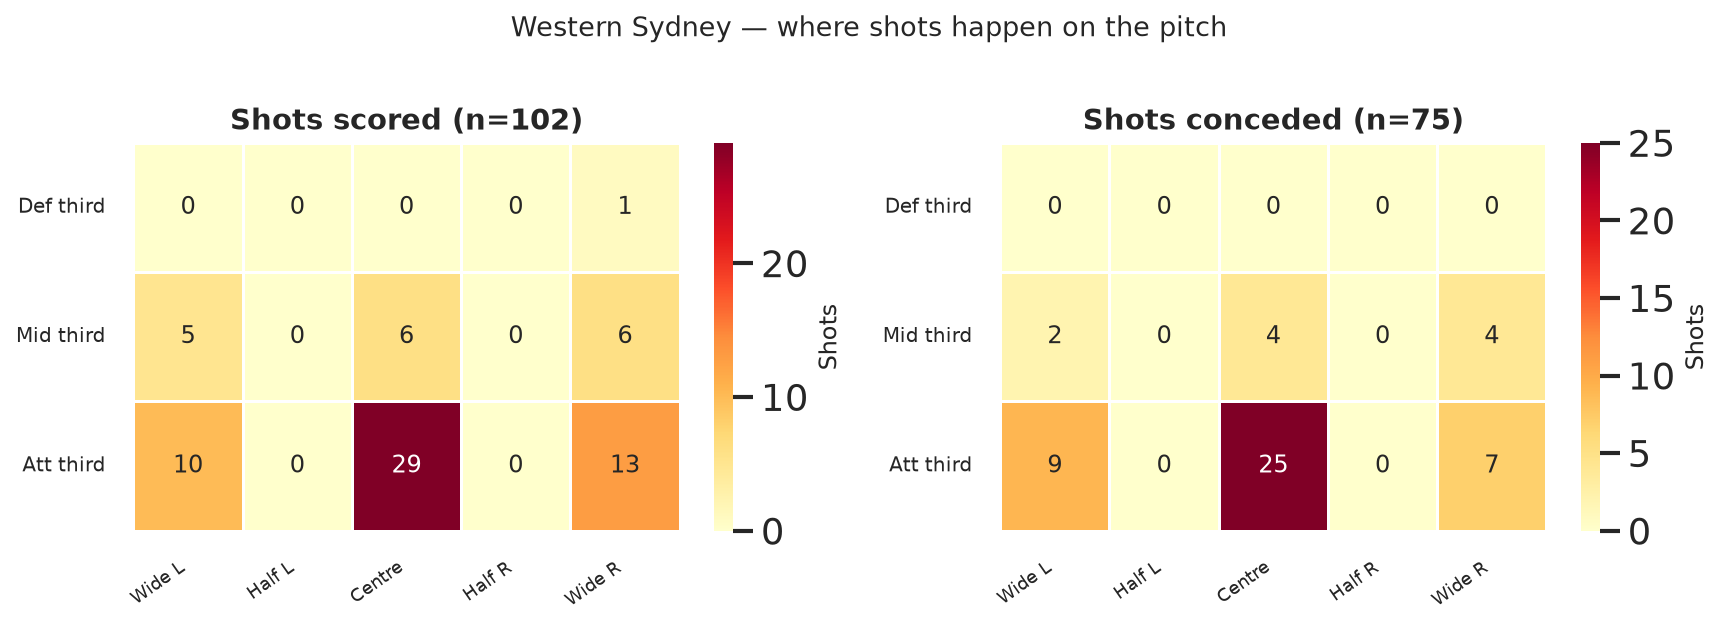
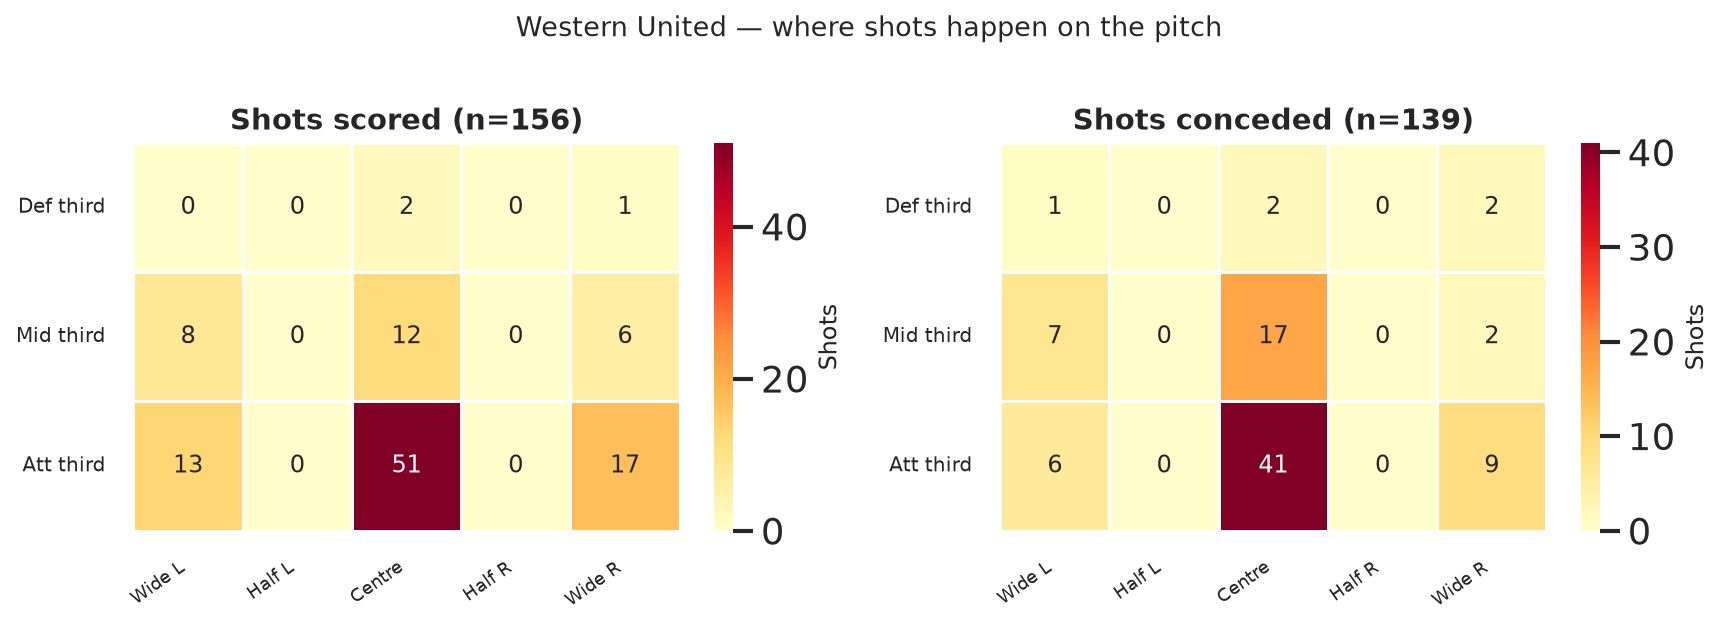
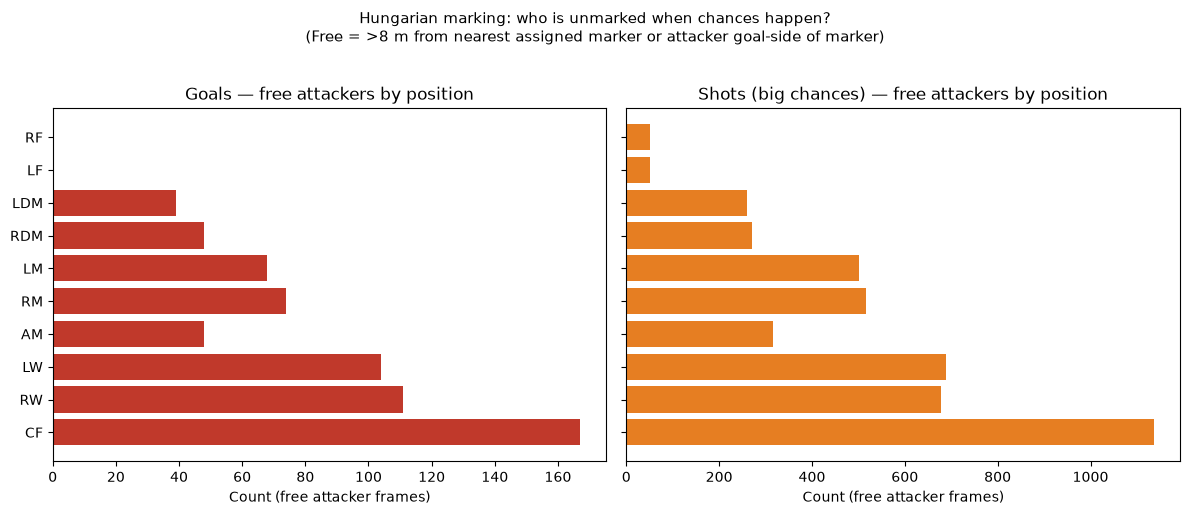
How long teams spend in each defensive situation (low / mid / high block, transitions, set pieces) and how often those spells end in a shot.Width and depth of the out-of-possession box. Red dots are phases that ended in a shot — often a slightly tighter shape.Compactness = how small the defensive rectangle is. Shot phases tend to be tighter, especially in a low block.How hard the ball-carrier is pressed. More pressure goes with more shots — but that often means the attack was already dangerous.Same story inside each block height: heavier pressure on the ball, more shots.When a defender steps to the ball: how often they win it back vs how often a shot still follows.Where on the pitch those steps happen — high press up field, recovery runs deeper.SkillCorner tags: organised shape, ball inside the block, number of lines — vs shot rate.How high the back line sits in each block type (validates low / mid / high labels).Did the press slow the attack or get beaten? Beaten flags line up with more shots.Linked presses: how many steps in a chain and whether it ended in a regain.Club comparison: average box size vs shots faced in organised blocks.Distance between defender and opponent when the press starts — not blank; uses inter-player distance from SkillCorner.Gradients = how shot rate changes as you move from tight→open shape (left) or low→high pressure (right), within each block.League-wide shot locations (centre-heavy). See team-zones.html for each club.teams/adelaide-united_zones.pngteams/auckland-fc_zones.pngteams/brisbane-fc_zones.pngteams/cc-mariners_zones.pngteams/macarthur-fc_zones.pngteams/melbourne-city_zones.pngteams/melbourne-v-fc_zones.pngteams/newcastle_zones.pngteams/perth-glory_zones.pngteams/sydney-fc_zones.pngteams/wellington-p-fc_zones.pngteams/western-sydney_zones.pngteams/western-united_zones.pngGraph tool: at goals and shots, which attacking roles were unmarked (Hungarian matching on tracking)?